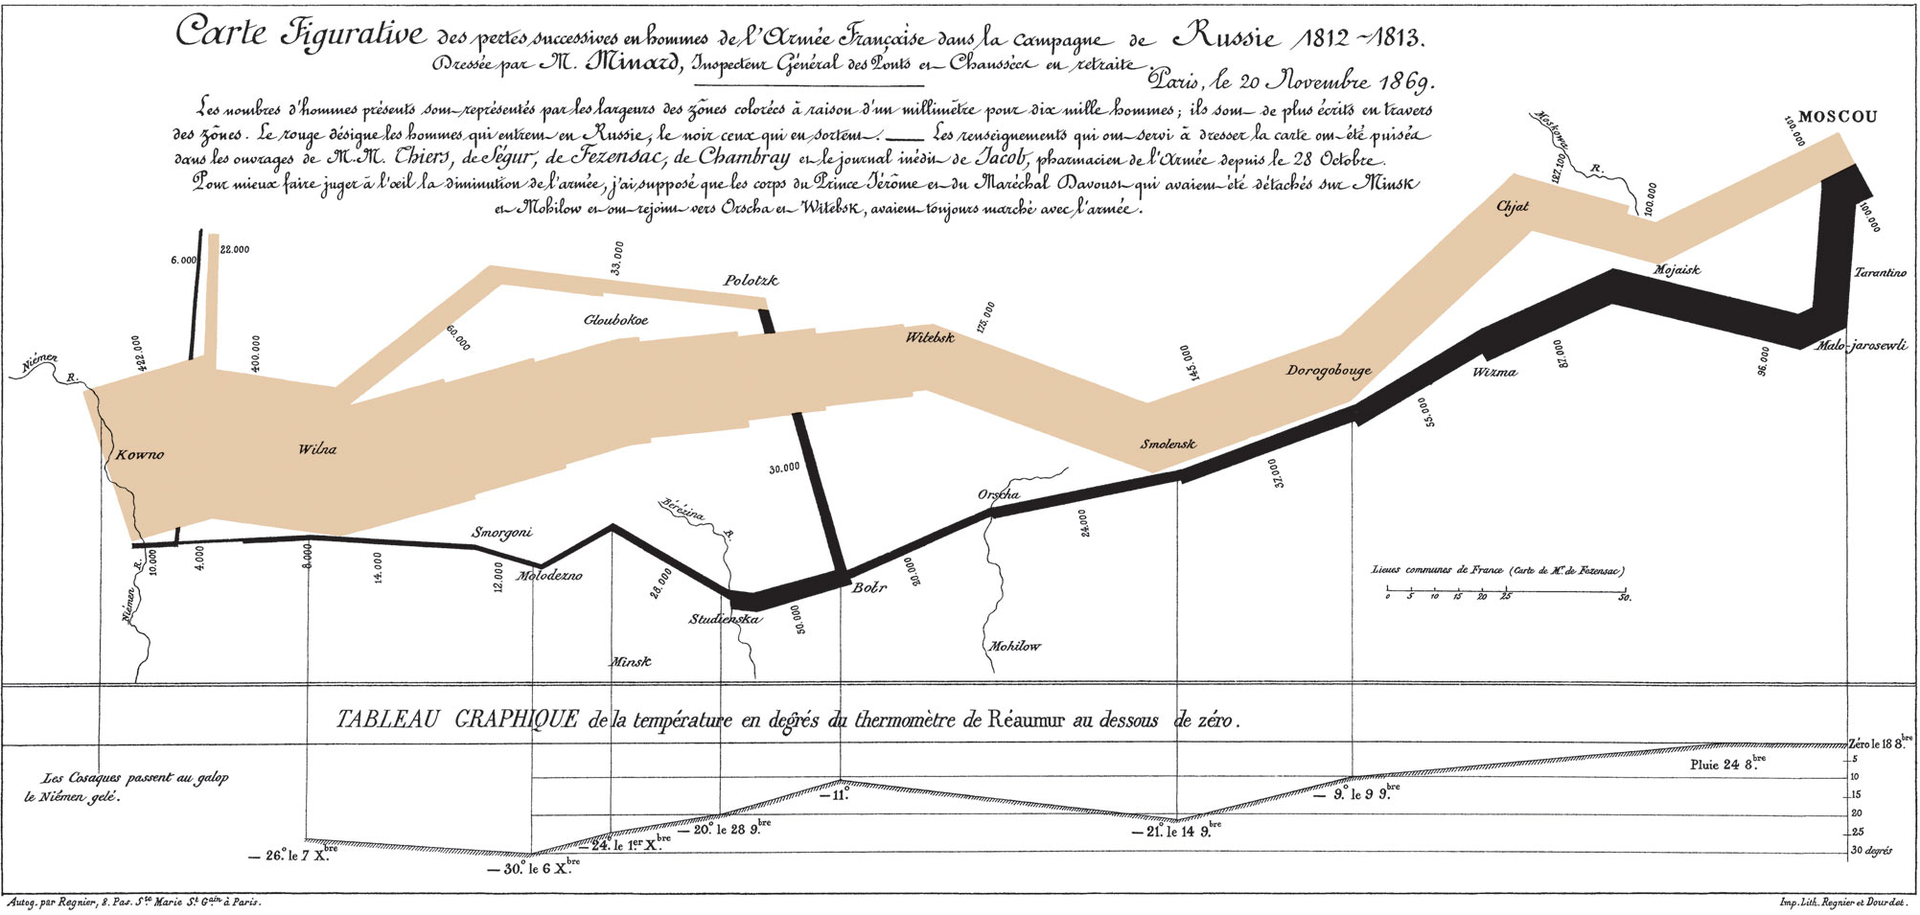
Charles Joseph Minard's map analyzing Napoleon's Russian campaign — called "the best statistical graphic ever drawn"
Data visualization is the visual representation of abstract information for data analysis or for communication. Effective visualization communicates information clearly and efficiently by means of graphics. It makes complex quantitative data more accessible and understandable.
Labs
- Cartographic Modeling Lab (CML) specializes in applying geographic information systems (GIS) software and hardware to digitally link data and geography to generate spatial databases, maps, spatial statistical analyses, and mapping applications, providing a useful way to reveal spatial and temporal relationships among data. The CML is a research unit within the Biostatistics Analysis Center (BAC) of the Perelman School of Medicine's Center for Clinical Epidemiology and Biostatistics (CCEB).
- Center for Digital Visualization (ViDi) brings together Engineering and Humanities faculty to embark on deeply collaborative investigations to discover new Computer Graphics modeling and animation methods and apply the best and most appropriate techniques to modeling and visualization challenges presented by human artistic, structural, and cultural artifacts.
Data Visualization Services
- Qlikview is a product which facilitates the visualization of data analysis. It is user friendly and provides fast in-memory analysis capabilities by dynamically integrating and presenting data from multiple data sources. Penn has a license for it.
- Tableau is a free service that lets anyone publish interactive data to the web. Once on the web, the results are shared publicly. No programming skills are required. There are some limits on the amount of data which can be published.
- PowerBI is a suite of business analytics tools to analyze data and share insights. It offers tools for interactive data visualization.
- Stata is a complete, integrated statistical software environment that provides everything you need for manipulating and analyzing data using statistical and graphical methods. It is no longer available through a Penn license, but educational pricing is available. See "How do I order Stata?"
Penn Licensed Software
|
MATLAB, created by MathWorks, is a high-level technical computing language and interactive environment for algorithm development, data visualization, data analysis, and numeric computation. |
Details | How to Order | Order Form |
|
ArcGIS makes it easy to create maps and add your own data to them. Using ArcView GIS software's powerful visualization tools, you can access records from existing databases and display them on maps. |
Details | How to Order | Order Form |
|
IDL (Interactive Data Language) by Excelis Visual Information Solutions, provides the necessary tools for data analysis, scientific visualization and cross-platform application development. |
Details | How to Order | Order Form |
|
JMP software dynamically links statistics with graphics to interactively explore, understand, and visualize data. |
Details | How to Order | Order Form |
|
Mathematica, by Wolfram Research, provides interactive calculation tools, visualization tools, and a complete programming environment. |
Details | How to Order | Order Form |
|
SAS provides tools essential for data access, management, analysis and presentation. |
Details | How to Order | Order Form |
Open Source Software
- R is a free software environment for statistical computing and data visualization. It compiles and runs on a wide variety of UNIX platforms, Windows and MacOS.
Training
There is access to free training for some of these tools. See our training resources page.
For further information, please consult with your Local Support Provider.