Jonathan Baron1
University of Pennsylvania
``Utility'' refers to the value that individuals gain from the consumption or experience of goods of all kinds,1 from mundane goods such as toaster ovens to more noble and essentially human goods such as friendship. One might be tempted to think of utility as a very inclusive generic good, but that would be, at least in one important respect, a mistake. ``Wealth,'' for example, is a generic term for material goods. But wealth and utility differ not only in their level of generality, but also in that wealth exhibits declining marginal utility while utility does not.
To say that a good exhibits declining marginal utility is to say that the more of that good that an individual has, the less valuable having more of it will be to that individual. Money, for example, tends to exhibit declining marginal utility, as illustrated by the fact that the utility you would gain from increasing your wealth from $1,000,000 to $1,001,000 would almost certainly be smaller than the utility you would gain from increasing your wealth from $1,000 to $2,000.
Utility is not a generic term meaning something like ``valuable stuff'' because utility does not itself exhibit declining marginal utility. For it to do so would be incoherent. You can gain different amounts of utility from the same quantity of good depending on your circumstances, but under no circumstances can you gain different amounts of utility from a given quantity of utility.
With few exceptions, goods exhibit declining marginal utility. This has a number of important consequences, two of which concern us here. The first is that declining marginal utility provides a rationale for risk aversion. The second is that, given certain assumptions, it provides an account for the value of equality in utilitarian terms. In both cases, of course, other factors may be involved, such as the emotions of fear (for risk aversion) or envy (for equality).
By ``risk aversion'' we mean behavior reflecting an unwillingness on the part of an agent to take certain risks even when the risky actions promise higher expected returns than the other courses of action available. For example, suppose you are offered a choice between a guaranteed $500 and a lottery ticket that will, depending on the outcome of a fair coin-toss, give you $1,100 or nothing. The ``expected value'' (i.e. ``expected monetary value'') of the lottery ticket is $550, $50 more than the guaranteed $500. But many people, perhaps most people, would choose the sure thing in spite of this fact. Why?
Because of the declining marginal utility of money, not all dollars are equal in value. Recall that the more one has of a good, the less each additional unit of good tends to be worth to that person. Thus it is entirely possible that the first $500 will be worth more to our imagined agent than the second $600, and if that is the case, the expected value of the sure thing will be higher than that of the ticket in terms of expected utility, even if it's lower than that of the ticket in terms of expected monetary value. Thus, the fact that goods tend to exhibit declining marginal utility allows us to accommodate risk aversion within the framework of rational choice.
The second consequence of declining marginal utility is that it provides at least a partial account for the value of equality in utilitarian terms. This consequence, however, depends on two further assumptions. The first is that interpersonal comparisons of utility are meaningful. This means that it can make sense to say things like, ``Elizabeth will get more utility out of having a new car than Daniel will get out of having a bowl of ice cream.'' The assumption is that, however difficult it may be to make anything close to precise measurements of the utility that people gain from the goods they enjoy, comparisons of utility between people make sense and are possible in principle, if not in practice.
The second assumption on which this account depends is that people's utility curves are roughly similar in size and shape. That is, we are assuming that different people will tend to get roughly the same amount of value out of a given level of material or political well-being. Suppose, for example, that we have two people, A and B, one of whom is rich, well educated, and politically free and one of whom is poor, poorly educated, and politically restricted. Our assumption entails that A would enjoy living the good life about as much as B would and that A and B's respective experiences of the bad life would be similarly comparable.
Given these two assumptions and the fact of declining marginal utility, we can see why maximizing utility tends to maximize equality as well. Consider a pauper and a millionaire. On the one hand, if the pauper were to gain an additional thousand dollars, it would probably make a significant difference to the quality of his life. If, on the other hand, the millionaire were to lose a thousand dollars, she might not be as well off as she was before, but the quality of her life would probably not change dramatically. Thus, if we were to transfer a thousand dollars from the millionaire to the pauper, we would almost certainly increase the total level of utility.2 What's more, we could say the same about nearly all transfers of wealth or power from those who have more to those who have less. Thus, maximizing utility tends to maximize equality.
For the utilitarian, equality is of great value, but it is not a distinct value from the value of happiness/utility. Many, if not most, people tend to think of equality as valuable for its own sake and not just because of the effects that equality has on the overall level of happiness/utility. Nevertheless, the fact of declining marginal utility offers, at the very least, a plausible partial account of our egalitarian values and intuitions.
Given that declining marginal utility is so prevalent, it shouldn't be at all surprising if people tend to internalize the fact of declining marginal utility in their everyday decisions and judgments. After all, only one good surely has constant marginal utility, and that's utility. (Remember, though, that utility is not a ``good'' in the sense we've been using the term.) Of course people never have to make judgments about utility per se in their everyday lives.
Still one might wonder what happens on the occasions when they do need to make such judgments, either for professional reasons or, perhaps, because they are participating in a psychology study that requires them to? In making such esoteric judgments, do they take the pains necessary to exclude whatever momentarily inappropriate intuitions they have developed over a lifetime of reasoning about the goods of everyday life? We conducted two studies to try to answer this question. Our results suggest that people tend to treat utility as if it were a generic sort of good, as if it itself exhibited declining marginal utility.
Although we think this is an error, one tradition of decision theory would imply that it is not. This tradition makes a distinction among various types of utility measures, or perhaps types of utility. Three types of interest here are von Neuman-Morgenstern (vN-M) utility, social utility, and value. vN-M utility (von Neumann, & Morgenstern, 1947) is measured by standard gambles. It is the kind of utility to which expected-utility theory applies, and it is relevant to decisions under uncertainty or risk. Social utility is relevant to allocations across people (Nord, 1995; Nord et al., 1999). Just as vN-M utility supposedly takes risk attitude into account, social utility takes distributional justice into account. It can be measured by methods involving comparison of distributions across people, such as the person trade-off method (Nord, 1995). Value, the third type, involves direct judgments of utility differences (or strength of preference, see Krantz, Luce, Suppes, & Tversky, 1971, ch. 4, for the theory, and Barron, von Winterfeldt, & Fischer, 1984, and Krzysztofowicz, 1983, for empirical examples). Such judgments can be applied to outcomes with probability 1, gambles, or distributions.
Scholars who advocate the use of different measures for different purposes tend to assume that each type of measurement method can yield internally consistent utility scales. For example, all three methods are capable of measuring utility differences, and within any method the utility (or value) difference between outcomes A and B plus that between B and C should equal that between A and C. It is also assumed that the three scales need not agree with each other, and that each type of utility is relevant to a particular type of decision.
Other scholars have argued that disagreement among scales is nonnormative (e.g., Richardson, 1994; von Winterfeldt & Edwards, 1986; Wakker, 1996). For one thing, the distinction among types of utility was introduced in part to account for the empirical fact that judgments disagree. Such disagreement, however, can be explained in many other ways (such as anticipated emotions or biased judgments - see Baron, 2000), which also explain observed inconsistencies within each measure (e.g., de Neufville & Delquié, 1988; Baron et al., 2000).
Secondly, it is an illusion that anything has probability 1. A description of some outcome with probability 1 hides subsequent uncertainties (von Winterfeldt & Edwards, 1986, p. 213). Thus, the claim that vn-M utility is sometimes not relevant depends on an artifact of description, a kind of framing effect.
Thirdly, different functions can lead to conflicting decisions about the same cases. For example, supposed that the social utility of a risky medical procedure is higher than the vn-M utility of the same procedure for each individual in a group. Then it could be socially optimal to give the procedure to everyone, yet optimal for each individual not to have the procedure. Such a state of affairs would violate a very basic assumption of social decision making, which Broome (1992, p. 165) calls the Principle of Personal Good: ``(a) Two alternatives are equally good if they are equally good for each person. And (b) if one alternative is at least as good as another for everyone and definitely better for someone, it is better.''
The same argument applies to value functions. Suppose that our social utility judgment says that ``person A gains G1, and person B loses L2'' is worse than ``nothing happens'' (regardless of what else happens to A and B, so long as it is the same under both options). It also says that ``B gains G2, and A loses L1'' is worse than nothing (again, regardless of what else happens). Yet, our individual judgments are that ``A gains G1'' vs. nothing is a larger interval than nothing vs. ``A loses L1,'' and that ``B gains G2'' vs. nothing is a larger interval than nothing vs. ``B loses L2'' (regardless of other events). These judgments would imply that it is better for A to gain G1 and lose L1 than for nothing to happen, and likewise for B gaining G2 and losing L2. Our social judgments disparage the combination of both moves, ``A gains G1 and loses L1, and B gains G2 and loses L2.'' Yet the combination would increase the utility of each person, according to our judgments of value for each person.
Other arguments imply the same conclusion. For example, Broome (1992) argues for the normative consistency of what we are calling vnN-M utility and social utility, von Winterfeldt and Edwards (1986, pp. 211-215) argue for the normative consistency of value and vn-M utility, and Richardson (1994, pp. 9-12) argues against the idea of separate utilities for risky and riskless outcomes. In sum, inconsistent evaluations using different methods can lead to inconsistent decisions and thus cannot be normative standards for decision making.
In the first experiment, we asked subjects to make judgments about within-nation distributions of life expectancy and income, and within-employer distribution of salaries. Specifically, we asked them how much they would want to live in each country (or work for each employer) if they had an equal chance of falling into the top, middle, or bottom group. This was an attempt to simulate the ``veil of ignorance'' (which Rawls, 1971, p. 137, attributes to Harsanyi, 1953) as a method of evaluating distributions.
Then we asked the subjects to rate the utility of the same goods. Finally, we asked for judgments about distributions again, but the goods were described in terms of utility ratings rather than in terms of years or dollars. From the ratings given to the distributions, we inferred a utility function for each good, and we likewise inferred a ``utility function'' for the utility ratings. The utility of the ratings should be linear, even if the utilities of the goods are marginally declining.
We also went through the same procedure for gambles. Subjects made decisions about a series of hypothetical gambles, from which we could infer a utility function for some amounts of money. We then asked for ratings of the utility of money and asked about utilities of gambles specified in terms of utility ratings. Again, the utility of utility ratings should be linear.
Fifty-one subjects completed a questionnaire on the World Wide Web. The subjects were 88% students, 43% male, and had a median age of 21 (range 17-50). (See Birnbaum, 2000, for evidence for the validity of data collection on the Web.)
The questionnaire had four parts, each part dealing with a different domain: distribution of life-expectancies in nations, distribution of salaries paid by employers, distributions of incomes within nations, and monetary gambles. The first part, concerning life expectancy, began, ``Countries differ in life expectancy because of health care, nutrition, and environmental factors such as clean water. Within countries, some people are better off than others in these things.
``The following table shows the average life expectancy for the top, middle, and bottom third of the population in each country. The top third means the top third in life expectancy. The figures refer to the expected average age of death, given current conditions in the country.
``In the following table, rate how much you would want to live in each country, IF YOU HAD AN EQUAL CHANCE OF FALLING INTO EACH THIRD. Look through the whole list and give the most desirable country a rating of 100 and the least desirable country a rating of 0. Then, give your other ratings so that differences are meaningful. For example, a rating of 50 should mean that this country is half way between the best and the worst in desirability.'' The table gave the following expectancies for the three thirds:
| Bottom third | Middle third | Top third |
| 70 | 80 | 85 |
| 50 | 60 | 75 |
| 60 | 70 | 85 |
| 60 | 80 | 85 |
| 50 | 70 | 75 |
| 50 | 60 | 85 |
| 50 | 70 | 85 |
| 50 | 60 | 65 |
| 50 | 80 | 85 |
| 60 | 70 | 75 |
Notice that the table represents every possible combination of 50, 60, or 70 at the bottom, 60, 70, or 80 at the middle, and 65, 75, or 85 at the top, such that the bottom is lower than the middle and the middle is lower than the top. This was the general design we used in all such tables.
Following this task, subjects rated the same table (redisplayed) for ``desirability as a society.'' We call the first rating Life-c, and the second, Life-d.
Then, subjects were given a list of life expectancies from 50 to 85, in steps of 5, and were instructed to ``rate the desirability of being in a group with the given life expectancy. Give the most desirable life expectancy a rating of 100 and the least desirable a rating of 0. Then, give your other ratings so that differences are meaningful. For example, a rating of 50 should mean that this life expectancy is half way between the best and the worst in desirability. The improvement from 0 to 50 should be just as desirable as the improvement from 50 to 100.''
Subjects were then given two distribution tables like the first one, and were instructed as in the first two tables except that:, ``The table shows the RATINGS OF LIFE EXPECTANCY given by someone just like you, as you gave them in the last column.'' Instead of life expectancies, the tables contained ratings of 0, 25, 50, and 75 instead of expectancies of 50, 60, 70, and 80, respectively, for Low and Middle thirds, and 50, 75, and 100 instead of 65, 75, and 85, respectively, for Top third. Subjects provided both choice (how much you would want to live in each country) and desirability ratings for the tables of ratings.
The second part concerned salaries paid by hypothetical employers. The subjects were again asked to rate each employer on the assumption of having an equal chance of falling into each third. Life expectancies of 50, 60, 65, 70, 75, 80, and 85 were replaced, respectively, with annual salaries (in thousands of dollars) of 30, 50, 60, 70, 80, 90, and 100. Otherwise, the numbers used were identical. There was no condition corresponding to ``desirability as a society.''
The third part concerned developed countries differing in annual income, expressed in equivalents of thousands of U.S. dollars. The respective levels were 15, 25, 30, 35, 40, 45, and 50. Again, subjects were asked only how much they would want to live in each country, not how desirable it was as a society.
The last part concerned hypothetical gambles. Subjects were told, ``In each of the following cases, suppose you won a lottery. You are offered a choice between a sure cash prize and another gamble. In each case, indicate whether you think you would take the gamble (g) or the sure prize (p). In each case, the gamble gives you some probability of winning a larger prize, but, if you lose the gamble, you win nothing.'' The larger prize was $2,000,000. The smaller prize was $1,000,000 in the first series of items, $750,000 in the second, and $500,000 in the third. Probabilities in the first two series started at 99% and then went down in steps of 5 to 50% in the first series and 35% in the others. (70% was inadvertently skipped in all series.) The third series started at 80% instead of 99%.
We used the highest probability at which the subject would take the gamble to determine the utility of the smaller amount relative to the larger, assuming that the subjects made decisions in terms of expected utility. For data analysis, we rescaled this utility linearly so that 0 represented the utility of the expected value of the gamble and 1 represented the utility of $2,000,000. This gives us a measure of declining marginal utility that is 0 if the utility function is linear, 1 if it is so concave that the subject would take no risk. (Only one data point was negative, implying a convex function.)
Subjects then rated the desirabilities of $2,000,000, $1,500,000, $1,000,000, $750,000, $500,000, $250,000, and $0. Finally, they repeated the choice task (gamble vs. sure prize) with ratings of 25, 50, and 75 replacing, respectively, sure prizes of $1,000,000, $750,000, and $500,000.
In general, subjects made no distinction between objective quantities and utilities. Judgments were more sensitive to changes at the bottom of the range than at the top. This was equally true when the situations were described in terms of objective quantities and utilities. These results cannot be explained in terms of linear utility functions. Utilities for life expectancy, salary, or income were marginally declining (on the basis of the ratings).
The measure of declining marginal utility was the utility difference between the utilities of the highest and lowest pairs of quantities of goods, e.g., the utility difference between 50 and 60 years life expectancy minus the utility difference between 75 and 85 years. Each difference, e.g., that between 50 and 60, was determined by averaging the pairs of distributions that differed only in which member of the pair occurred.
For ratings of distributions, the two differences were inferred by subtracting the ratings that involved these differences and held everything else constant (using the average of all relevant pairs). For example, the inferred difference between 50 and 60 was the mean of the differences: 60/70/85 - 50/70/85; 60/80/85 - 50/80/85; and 60/70/75 - 50/70/75. (Here, 60/70/85 represents the rating of this distribution of life expectancies.) Thus, each measure of declining marginal utility represents a difference of differences on a 100 point scale.
The mean declines (in marginal utility), computed in this way, are shown in Exhibit 1. The means for goods distributions (top row) and ratings distributions (second row) did not differ significantly across the goods. The means for ratings differed (F2,94 = 5.79, p = .0042), with income being less than the others. But, as we shall see, this is not replicated in Experiment 2.
| Insert Exhibit 1. |
More importantly, the declines of marginal utility for ratings were positive overall (t = 2.46, p = .0172, for the mean of the three goods), so this decline in perceived marginal utility of goods is consistent with the observed decline in marginal utility inferred from distributions of goods (t = 2.12, p = .0208, for the mean of the four measures). However, the decline of marginal utility inferred from the distributions of ratings should be zero, and it should be smaller than the decline inferred from the distribution of goods. It was not only greater than zero (t = 4.23, p = .0001, for the mean of the four measures) but also greater (but not significantly greater) than the decline for distributions of goods. In other words, the decline in marginal utility did not reduce as a result of using ratings rather than goods. People seem to have declining marginal utility for utility as much as for goods.
Subjects did pay attention to relative standing in the distribution. We compared the same interval (e.g., 60-70 years) in the middle and lower thirds of the distribution. Utility of this interval was larger when it was in the bottom third than in the middle third, and this was true for both goods (mean difference 4.3, t = 3.51, p = .0010) and ratings (mean 6.69, t = 4.08, p = .0002; the two kinds of judgment did not differ). However, the next experiment casts doubt on the importance of this result.
The results for gambles were somewhat different. Subjects did make a distinction between gambles described in terms of money and in terms of ratings. However, subjects were still risk averse for ratings. To analyze the gambles, we inferred the utility from the best gamble that the subject rejected in each series (eliminating series in which a worse gamble was accepted and a better one rejected), thus assuming that the subject would accept any gamble the slightest bit more valuable than the best gamble rejected in each series. We thus erred on the side of making the subject appear less risk averse, that is, with a utility function closer to linear. We measured the decline in marginal utility as (G-E)/(1-E) for each series of gambles, where G is the expected value of the best gamble rejected, divided by the maximum about to be won ($2,000,000 or a rating of 100) and E is the ratio of the certainty amount (e.g., $1,000,000) to the maximum. The decline ((G-E)/(1-E)) would be zero if the utility function is linear. We computed this only for the probabilities used in tasks using both money and ratings (.5 and .25 chance of winning).
For money gambles, the mean ratio was .72 (t = 29.1, p = .0000, for the hypothesis of zero; with all subjects showing concave utility functions), and for gambles in utility ratings, the mean was .52 (t = 14.9, p = .0000; with only one subject showing a convex function). Although marginal utility declined in the second case, the amount of the decline (.52) was clearly less than that in the first case (t = 6.77, p = .0000). Thus, subjects were sensitive to the difference between money and utility ratings of money. They were simply not sensitive enough.
In the second study, we adjusted the tables so that the levels of the goods (life expectancy, etc.) were equally spaced. Some levels were used in more than one part of the distribution (top, middle, bottom). For example, a life expectancy of 59 occurred sometimes in the low part and sometimes in the middle part of the distribution. This allowed us to examine effects of position in the distribution, holding the level constant. We also asked for ratings separately for each level in each part of the distribution, so that subjects could consider relative standing in their utility ratings. We omitted the gambles. We also advertised the questionnaire to newsgroups and mailing lists for philosophers and philosophy students.
The method was the same as Experiment 1, except that the gambles were omitted. As noted, we also changed the numbers in all the examples so that all numbers used in a table were equally spaced from each other. Life expectancies were either 50, 59, or 68 for the bottom third of the distribution, 59, 68, or 77 for the middle, and 68, 77, or 86 for the top. Thus, all numbers involved equal steps: 50, 59, ..., 86. As in Experiment 1, the table contained all possible combinations in which the bottom, middle, and top thirds were correctly ordered (50 59 77, 50 59 86, ... 68 77 86). Salaries went from $30,000 to $110,000 in steps of $20,000. Incomes went from $15,000 to $55,000 in steps of 10. Subjects rated each good with information about both the level of the good and about which third of the distribution it was in (e.g., 68 year, bottom third). They therefore rated nine goods. This made it clear to the subject that ratings could depend on relative standing as well as the absolute level of the good.
The 61 subjects were 46% male and ranged in age from 18 to 49, with a median of 21. The questionnaire was announced on various lists and newsgroups for philosophers, bioethicists, etc. This yielded few philosophers, but other subjects might have been attracted by those announcements. The subjects were 5% undergraduate students studying philosophy or social science, 60% other undergraduates, 2% philosophy graduate students (i.e., one), 13% other graduate students, 5% philosophy professors, and 15% others.
Half the subjects were tested in each order (distributions described in terms of goods first, or in terms of utility ratings first), and order did not affect any of the results reported.
Again, subjects made no distinction between goods and their utilities, and they showed declining marginal utility for both. They also, again, gave greater weight to those in the bottom third than those in the top third of the distribution, even though the ratings could take relative standing into account, and they did this equally when judging goods and when judging ratings.
Declines in marginal utility were computed as in Experiment 1. The mean declines are shown in Exhibit 2. The means for U(Goods) (top row) almost differed significantly (F3,117 = 2.25, p = .0856). Those for U(Ratings) did did not differ, and those for Ratings differed (F2,98 = 8.96, p = .0003). The differences did not resemble those in Experiment 1, and we have no explanation of why they come and go.
| Insert Exhibit 2. |
More importantly, the marginal utility declines for ratings were again positive overall (t = 3.99, p = .0002, for the mean of the three). The decline inferred from the distributions of ratings was again greater than zero (t = 5.53, p = .0000, for the mean of the four measures) and (this time) significantly greater than the decline for distributions of goods (t = 2.04, p = .047, for the mean of the three comparisons). Seventy-one percent of the subjects showed declining marginal utility for distributions of goods, and 83% for distributions of ratings. Again, the curvature of the ``utility'' function for utility ratings was no less than the curvature of the utility function for goods.
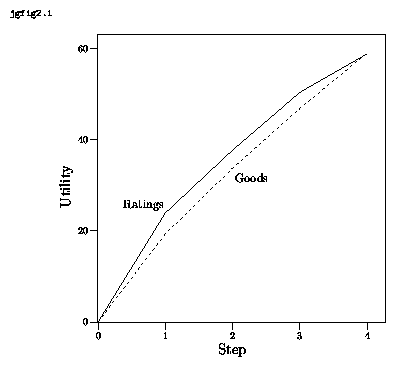
The results are shown in Exhibit 3, averaging across all the conditions. The steps represent the equal intervals of the magnitude of each good. The utilities are inferred by adding together the utilities of differences. It is apparent that both utility functions are marginally declining, whether they are based on goods or on utility ratings of goods.
| Insert Exhibit 3. |
Although only four subjects had done graduate work in philosophy, their mean decline for U(Goods) was 11.5 and their mean for U(Ratings) was 9.1, which are comparable to those of other subjects and clearly show no decline.
Subjects did pay attention to relative standing. Again, we compared the same interval (e.g., 59-68 years) in the middle and lower thirds of the distribution. Utility of this interval was larger when it was in the bottom third than in the middle third, and this was true for both goods (mean difference 5.5, t = 4.76, p = .0000) and ratings (mean 7.37, t = 10.13, p = .0000). However, the present experiment allowed us to ask the parallel question for middle versus top groups. Here, we might expect that the top group would get no more weight than the middle group, but, in fact, the top group received more weight (for goods, mean 4.7, t = 4.30, p = .0001; for ratings, mean 2.8, t = 2.87, p = .0057). Moreover, the difference in weight between the bottom and middle and the difference between the top and middle were not significantly different. It would thus appear that the differential weight given to the bottom group was an effect of attention rather than of some intuition about justice. It is difficult to imagine a justice intuition that would count the top group more than the middle. Another possibility is that some subjects engaged in wishful thinking.
People mistakenly tend to think of utility as if it were a generic sort of good, as if it itself exhibited declining marginal utility. Once again, we draw this conclusion from the fact that the judgments were declining in slope, not only with respect to goods (which makes perfect sense) but also with respect to utility as well (which makes no sense).3 It is worth emphasizing that the subjects demonstrated their understanding of the concept of utility. They not only distinguished utility from goods, but also indicated their understanding of the declining marginal utility of goods. Yet in spite of their basic grasp of the utility concept, they made judgments that cannot be justified in terms of rational choice.4 Our explanation for the subjects' response is that in making their judgments they misapplied their otherwise appropriate intuitions about declining marginal utility to utility itself.
This finding and this interpretation in no way suggest that people are prone to errors of the kind we have described in their everyday judgments. This result concerns only people's ability to reason correctly about utility itself. Naturally, these results are primarily, if not exclusively, the concern of philosophers, economists, psychologists, and the like. We hope that this result will be of general interest to these groups.
One possible implication of our findings is that utility judgments are sometimes subject to an intuition of marginal decline even when such decline is absent. We argued here that there is no marginal decline, in fact, for the utility of utility. Another possible example arises when utility (or disutility) is marginally increasing. For example, Varey and Kahneman (1992) told subjects that A must carry a 30-pound suitcase for 200 yards, B must carry it for 550 yards, and C must carry it for 900 yards. When subjects were asked whether B's overall physical discomfort is closer to A's or C's, most subjects thought it was closer to C's. The answer implies marginally declining disutility. (Other judgments did not show this effect.) Given such results, it is possible that, even when utility is truly marginally declining, subjects over-estimate the amount of decline, because they rely on a general heuristic. This sort of thing may happen in contingent-valuation studies or in gambling experiments with small amounts of money, where the true decline in marginal utility is very small, but subjects sometimes behave as if it were large.
There is one longstanding controversy to which we feel our main result is especially relevant, namely the controversy surrounding utilitarianism as a theory of normative ethics.
A major objection to utilitarianism is that fails to be sufficiently egalitarian or libertarian because it is only concerned with total levels of utility and not with how utility is distributed per se or with how such distributions are achieved. Utilitarianism is indifferent between any two distributions of utility that are equal in their sums. A society in which the utility is distributed very unevenly may be considered by utilitarianism to be just as good as one in which the distribution of utility is perfectly fair. And yet, the more egalitarian society seems obviously preferable. Indeed, Rawls puts the point quite well:
[As far as utilitarianism is concerned] there is no reason in principle why the greater gains of some should not compensate for the lesser losses of others; or more importantly, why the violation of the liberty of a few might not be made right by the greater good shared by many. (p. 26)
This objection, which we will call the ``distributive objection,'' has a great deal of intuitive force. We suggest, however, that much of that force is supplied by a mistaken tendency to think of utility as if it were a generic sort of good.
If you, like our subjects, tend to think of utility as something like ``valuable stuff,'' you are bound to find this objection more forceful than you ought to. We can run though the objection while explicitly making this misinterpretation. We are asked to consider two societies, both of which have the same amount of aggregate ``valuable stuff,'' one of which distributes the stuff fairly while the other does not. What are you likely to imagine here? You might be inclined to picture something like a wealthy aristocrat who is able to maintain his fleet of exotic cars, art collection, and summer home because other less fortunate members of the society go hungry. His ``greater gains'' (lots of expensive stuff) are maintained at the expense of other people's ``lesser losses'' (a few loaves of bread). As an alternative you might imagine a different society, equally full of valuable stuff, but in which the stuff is distributed fairly. Naturally one who interprets the distributive objection in this way is going to think it quite forceful, but to do so is a mistake. A moment's reflection reveals that utilitarianism, properly interpreted, favors the alternative society as well. This is readily seen by considering how easily the level of aggregate happiness would be increased if we began a process of transferring the aristocrat's wealth to the others. (The money received from selling one of his fancy cars would probably feed several poor people for a year.) Clearly, this scenario is not the sort of thing that one should have in mind when pressing the distributive objection.
The distributive objection is concerned with liberty, or equality of liberty, as well as material equality. The fear behind this version of the objection is that some regimes will maintain a high level of utility through offensive violations of freedom. Here, Rawls' choice of example, in one place at least (p. 167), encourages the kind of misinterpretation described above. He imagines a slaveholder trying to justify to his slaves their lack of freedom on the basis of the principle of utility. The implication is that an institution of slavery might, in some situations, maximize utility. (Rawls, of course, thinks that the problem with this slaveholder lies in is his choice of principle rather than his application of it.) Here the word ``slavery'' does all the work. A bit of reflection reveals that no institution that we would be inclined to call ``slavery'' would be endorsed by utilitarianism. Imagine a society in which half of its members are enslaved.5 That would mean that you, as a prospective member of this society, would have an equal chance of being a slave or a slaveholder. Now ask yourself (as a non-slave, non-slaveholder), which change would be more dramatic, the increase in happiness you would experience from acquiring a slave (assuming you have no moral problems with doing so) or the decrease in happiness you would experience by becoming one? There's no question. Slavery is much worse for the losers than it is better for the winners. The idea that utilitarianism would endorse ``slavery'' is absurd. ``But,'' one might respond, ``It's still possible that utilitarianism could endorse slavery in principle. You're still relying on empirical assumptions that could be mistaken. (And the same goes for the case of the wealthy aristocrat above.)'' Not so. What utilitarianism would endorse in principle is the curtailing of some individuals' liberties for the sake of aggregate welfare. But such institutions we would never call ``slavery.'' We would probably call them ``having a penal system'' or ``not allowing people with poor eyesight to operate automobiles.''
The distributive objection traditionally derives its force from the idea that there are possible societies that have undesirable inequalities (whether of wealth or freedom) that can only be eliminated at the expense of aggregate utility. Could such societies exist? How might we imagine one? The inequalities described in the previous paragraphs are certainly undesirable, but as we saw, eliminating them would raise aggregate utility. Capitalism tends to result in inequalities, but when those inequalities cease to be desirable, getting rid of them tends to raise aggregate utility as well. (Remember the billionaire and the pauper. Curbing the inegalitarian excesses of the free market inevitably translates into transferring resources from those who will gain less utility from them to those who will gain more.) It is very hard, perhaps impossible, to imagine a society in which the inequalities are undesirable and utility maximizing. And yet unless there are such cases, the distributive objection is toothless.6
Rawls is aware of the utilitarian's appeal to declining marginal utility, but seems to miss the point. He says that the ``utilitarian's standard assumptions `that persons have similar utility functions which satisfy the conditions of diminishing marginal utility' ... may be only probably true, or doubtfully so'' (pp. 159-160). Rawls is correct in suggesting that there will be cases in which these assumptions fail and in which utility and equality/liberty do in fact conflict (as is the case with the inequalities engendered by capitalism), but he implies that in such cases we would regret favoring the principle of utility, i.e. that the cases in which the standard assumptions fail to hold are a problem for utilitarianism:
It is characteristic of utilitarianism that it leaves so much to arguments from general facts. The utilitarian tends to meet objections by holding that the laws of society and of human nature rule out the cases offensive to our considered judgments. ... It may be unreasonable to rely on these hypotheses. ... Thus it seems that the parties [in the original position] would prefer to secure their liberties straight away rather than have them depend upon what may be uncertain and speculative actuarial calculations. (p. 160.)
As Rawls sees it, the utilitarian is out of luck if the world turns out to be different from how she thinks it is, for if her theory of human nature or what have you happens to be wrong, then her normative theory has deeply offensive implications. But this misses the point. The point of harping on the fact of declining marginal utility is not to argue that these offensive cases are so unlikely to occur that we can afford to ignore them. The point is - or should be - to keep us honest as we imagine what kinds of arrangements would or could be endorsed by utilitarianism. We have strong reasons to believe that people are inclined to imagine incorrectly the sorts of hypothetical situations with which the distributive objection is concerned and thus to find the distributive objection more forceful than they ought to.
We would like to emphasize that a fair amount turns on this seemingly minor point. Rawls' project is often described as an attempt to provide an alternative foundation for moral and political thought - an alternative, that is, to the utilitarian approach which, until recently, had dominated Anglo-American political and ethical theory. Therefore it is important to the Rawlsians project, so understood, that Rawls' foundational principles not lead to the same old utilitarian normative theory. If it turns out that the principle of utility and its consequences have been misunderstood, then it's not at all clear that the parties in Rawls' ``original position'' would fail to choose a principle of utility after all, and thus it is not at all clear that Rawlsian contractualism offers a foundation for non-utilitarian normative theories, as is so often supposed.
1 This is rough definition, as utility has been defined in different ways. According to one tradition, utility is defined either as pleasure (less pain) or happiness (less unhappiness) or ``agreeable states of consciousness'' (less disagreeable ones). The other main tradition conceives of utility as the satisfaction of people's informed preferences or desires.
2 Note how this depends on our making the two assumptions above. If we couldn't make interpersonal comparisons of utility then we couldn't say anything about how much utility two different individuals, in this case the pauper and the millionaire, stand to gain from a particular good. And if we were not willing to assume that their utility curves were roughly similar then we couldn't rule out the possibility that the person who happens to be the millionaire just happens to get much more out of whatever goods come his way than the person who happens to be the pauper does.
3 Broome (1991, section 9.2) discusses a form of egalitarianism in which the value of equality is represented as a transformation of the utility function. He calls this ``moderate communal egalitarianism.'' If subjects adopted this view, they would still show less declining marginal utility for utility ratings than for goods. So this possibility cannot explain our results. Note also that we specifically instructed subjects to make utility ratings of people's good in context, so that subjects were encouraged to take into account the effects of position in the distribution on the good of individuals. Subjects were thus free to adopt the view that Broome calles ``individualistic egalitarianism,'' in which the good of individuals is affected by their place in the distribution.
4 Of course these subjects did not have a complete grasp of the utility concept. Indeed, our study was designed to reveal the fact that they do not. The question, however, is whether or not philosophers etc. understand utility as they should, on the one hand, or as our subjects did, on the other.
5 You can run this sort of thought experiment with any slave/slaveholder ratio and the result will be the same. We can try a 3/1 ratio. Which choice seems to you to have a higher expected utility (A) remain a non-slave, non-slaveholder or (B) have a 75% chance of becoming a slave and 25% chance of being free and receiving the benefits of owning three slaves? Let's try 1/3. Which yields a higher expected utility, (A) as above or (B) having a 25% chance of becoming a slave and a 75% chance of remaining free and receiving the benefits of sharing a slave with two other people? No matter how you set things up, it seems pretty clear that slavery will never maximize expected utility.
6 Unless one finds it forceful for some reason other than the worry about repugnant inequalities.
Baron, J., Wu, Z., Brennan, D. J., Weeks C., and Ubel, P. A., (2000). Analog scale, ratio judgment and person trade-off as utility measures: biases and their correction. Journal of Behavioral Decision Making.
Barron, F. H., von Winterfeldt, D., & Fischer, G. W. (1984). Empirical and theoretical relationships between value and utility functions. Acta Psychologica, 56, 233-244.
Birnbaum, Michael H. (Ed.) (2000). Psychological Experiments on the Internet. New York: Academic Press.
Broome, John. 1991. Weighing goods: Equality, uncertainty and time. Oxford: Blackwell.
de Neufville, R., & Delquié, P. (1988). A model of the influence of certainty and probability ``effects'' on the measurement of utility. In B. Munier (Ed.), Risk, Decision, and Rationality, pp. 189-205. Dordrecht: Reidel.
Harsanyi, John C. (1953). Cardinal utility in welfare economics and in the theory of risk taking. Journal of Political Economy, 61, 454-435.
Krantz, D. H., Luce, R. D., Suppes, P., & Tversky, A. (1971). Foundations of measurement (Vol. 1). New York: Academic Press.
Krzysztofowicz, R. (1983). Strength of preference and risk attitude in utility measurement. Organizational Behavior and Human Performance, 31, 88-113.
Nord, E. (1995). The person trade-off approach to valuing health care programs. Medical Decision Making, 15, 201-208.
Nord, E., Pinto, J. L., Richardson J., Menzel, P., Ubel, P. A. (1999). Incorporating societal concerns for fairness in numerical valuations of health programs. Health Economics. 8, 25-39.
Rawls, John. 1971. A Theory of Justice, Cambridge, MA: Harvard University Press.
Richardson, J. (1994). Cost-utility analysis: What should be measured? Social Science and Medicine, 39, 7-21.
Scheffler, Samuel (Ed.). 1988. Consequentialism and its Critics. Oxford: Oxford University Press.
Varey, C., & Kahneman, D. (1992). Experiences extended across time: Evaluation of moments and episodes. Journal of Behavioral Decision Making, 5, 169-185.
von Neumann, J., & Morgenstern, O. (1947). Theory of games and economic behavior (2nd ed.). Princeton: Princeton University Press.
von Winterfeldt, D., & Edwards, W. (1986). Decision analysis and behavioral research. Cambridge University Press.
Wakker, P. (1996). A criticism of healthy-years equivalents. Medical Decision Making, 16, 207-214.
Exhibit 1. Means of declines in utility (utility of bottom difference minus utility of top) on a 100 point scale, inferred from ratings of distributions of goods and of distributions of ratings of the goods. The bottom row shows the declines in utility from the direct ratings.
| Life-c | Life-d | Income | Salary | |
| Goods distributions | 4.5 | 10.2 | 9.6 | 9.2 |
| Ratings distributions | 10.9 | 13.0 | 13.7 | 12.2 |
| Ratings | 9.1 | -1.5 | 4.9 |
Exhibit 2. Means of declines in utility (utility of bottom difference minus utility of top) on a 100 point scale, inferred from ratings of distributions of goods and of distributions of ratings of the goods. The bottom row shows the declines in utility from the direct ratings.
| Life-c | Life-d | Income | Salary | |
| Goods distributions | -0.3 | 8.1 | 14.1 | 6.5 |
| Ratings distributions | 11.4 | 20.2 | 16.1 | 14.8 |
| Ratings | 0.2 | 12.3 | 10.2 |
Exhibit 3. Implied utility ratings from Experiment 2.
1This research was supported by N.S.F. grant SBR95-20288 to J. Baron. Send correspondence to Joshua Greene, Department of Philosophy, Princeton University, or (e-mail) baron@psych.upenn.edu.