|
|
1. How much do you worry about each of these risks, on the average, for you and your immediate family? Answer on a scale of 1 to 7, where 1 means "not at all" and 7 means "a great deal." A "great deal" means that you think about it often and that you are greatly bothered by the thought of the bad event in question. 2. Imagine there were a way to completely eliminate some of these risks to you and your family. Indicate the priority you would give to eliminating each risk to you and your family. [This is what we call "personal action." The responses were High, Medium, Low, or None, coded as 4, 3, 2, and 1, respectively.] 3. Imagine there were a way to completely eliminate some of these risks to the American public as a whole. Indicate the priority you would give to eliminating each risk to the American public as a whole. [This is what we call "government action."] 4. What is the lifetime probability for the average American family [4a], and what is the lifetime probability for you and your family [4b], for each of the outcomes listed? To answer this question, use the risk ladder on the last page, which may help you in thinking about low probabilities or small proportions. When something can happen more than once, we want the probability that it happens at least once . [Figure 1 shows the risk ladder, which was logarthmically spaced. The web subjects saw only the text, not the vertical line.] 5. On a scale of 1 to 7, how accurate do you think that experts are in estimating the probability of this outcome for the average person? 7 means extremely accurate. 1 means extremely inaccurate, so that the true probability could be several times more or less than what any given expert thinks. 6. If this outcome happens, how many people, on the average, suffer the direct effect at the same time, from the same episode? Answer on the following scale:
1. This happens to one person at a time.
< 10. ... more than one person but usually less than 10.
< 100. ... more than 10 people but usually less than 100.
< 1000. ... more than 100 people but usually less than 1000.
More. ... more than 1000 people at once. 7. Of those who suffer this effect, how bad, on the average, is the impact for each person? Answer on a scale of 0 to 100, where 0 means not bad at all and 100 means as bad as a painful death. (You may go beyond 100 if you need to.)
| Response | Probability | Example (chance of) | |
| A | 1 in 1 | Certain to happen | |
| B | 1 in 3 | A 80 year old dying by 85 | |
| C | 1 in 10 | A 65 year old dying by 70 | |
| D | 1 in 30 | A 51 year old dying by 56 | |
| E | 1 in 100 | A 35 year old dying by 40 | |
| F | 1 in 300 | A 20 year old dying by 23 | |
| G | 1 in 1,000 | A 20 year old dying in the next year | |
| H | 1 in 3,000 | A 20 year old dying in the next 4 months | |
| I | 1 in 10,000 | A 20 year old dying in the next 5 weeks | |
| J | 1 in 30,000 | A 20 year old dying in the next 2 weeks | |
| K | 1 in 100,000 | A 20 year old dying in the next 4 days | |
| L | less than 1 in 100,000 | (specify the probability) | |
| Question (range) | Expert mean | Non-expert mean |
| Pers. action (1-4) | 2.45 | 2.76 |
| Gov't. action (1-4) | 2.82 | 3.12 |
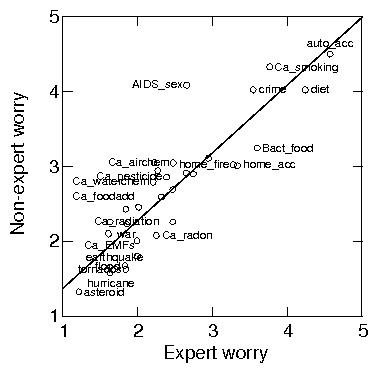
| Worry (1-7) | 2.45 | 2.71 |
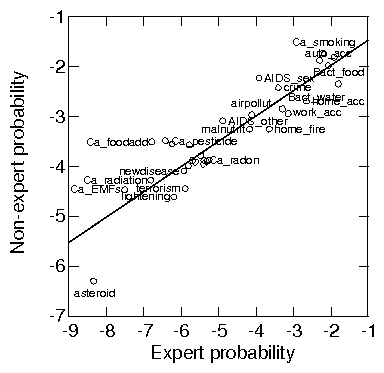
| Pers. risk (log prob.) | -5.53 | -4.04 |
| Avg. risk (log prob.) | -4.80 | -3.42 |
| Certainty (1-7) | 4.71 | 4.53 |
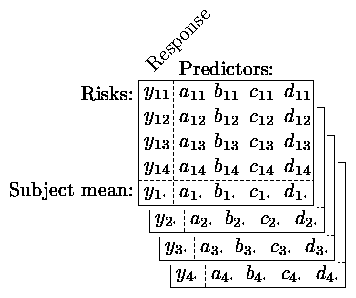
| Dependent variable: | |||||
| Personal | Gov't. | Personal | Average | ||
| Predictor: | action | action | Prob. | prob. | Worry |
| Expert | -.35** | -.41** | -.54** | -.53** | -.16 |
| Liberal | .15* | .20** | .06 | .07 | .05 |
| Sex | -.07 | -.18** | .05 | -.01 | -.03 |
| Age | .09 | .05 | .15 | .06 | .02 |
| Parenthood | -.07 | -.02 | .04 | .03 | -.03 |
| Married | .07 | .19* | -.16 | -.06 | .04 |
| R2 | .12** | .18** | .26** | .27** | .02 |
| Dependent variable: | ||||||
| Pers. | Pers. | Gov't. | Gov't. | |||
| Predictor: | action | action | Worry | action | action | Worry |
| Worry | .42** | .27** | ||||
| Pers. Prob. | .15* | .08 | .17* | |||
| Avg. Prob. | .28** | .22** | .20** | |||
| Expert | -.20** | -.18** | -.05 | -.12 | -.11 | -.04 |
| Liberal | .14* | .13* | .05 | .17** | .15** | .05 |
| Sex | -.06 | -.05 | -.02 | -.16** | -.15** | -.01 |
| R2 | .14** | .30 | .05* | .29** | .22** | .05* |
| Pers. | Gov't | Pers. | Avg. | ||||
| Worry | action | action | risk | risk | Cert. | Scope | |
| Pers. action | .6443 | ||||||
| Gov't. action | .4555 | .6187 | |||||
| Pers. risk | .4906 | .4916 | .3707 | ||||
| Avg. risk | .4474 | .4462 | .4608 | .6688 | |||
| Certainty | .1363 | .1326 | .1767 | .1587 | .2404 | ||
| Scope | -.0633 | -.0625 | .0206 | -.0779 | -.0827 | -.0462 | |
| Badness | .0492 | .0835 | .1113 | -.1311 | -.1175 | -.0007 | .0581 |
| Dependent variable: | |||||
| Personal | Personal | Gov't. | Gov't. | ||
| action | action | action | action | Worry | |
| Predictor | |||||
| Worry | .475 | .252 | |||
| Pers. Prob. | .248 | .493 | .490 | ||
| Avg. Prob. | .304 | .416 | |||
| Badness | .098 | .166 | .131 | .162 | .120 |
| Certainty | .032 | .058 | .076 | .085 | .057 |
| Scope | (-.003) | (-.028) | .118 | .101 | (-.028) |
If you had more money to spend, which of these risks would you spend it on? Circle the priority you would give to each risk: Hi=high, Med=medium, Lo=low, No=no money at all. [Note: We are interested in all expenditures in advance, whether they reduce the probability or magnitude.] If the government had more money to spend, which of these risks would you like the government to spend it on? Circle the priority you would give to each risk: hi=high, med=medium, lo=low, no=no money at all.Forty-two others completed the same questionnaire in a one-on-one interview. The interviewer answered the subjects' questions, checked the answers for completeness, and asked a series of follow-up questions. Interview subjects were limited to those living on their own (i.e., not in university residences or with their parents) because the follow-up questions concerned protective behaviors that would be relevant only for such people. We attempted to get a varied sample of people living near the University of Pennsylvania, in West Philadelphia, a community consisting of students, university staff, and a variety of ethnic groups. The web subjects were similar to those in Experiment 1. Web subjects were younger than those who had interviews (median age 19 vs. 30.5, ranges 18-47 vs. 18-81, p=.0000 by U test), had fewer children (means 0.3 and 0.8, p=.0011 by U test), more likely to be students (92% vs. 45%, p=.0000 by Fisher test), but no different in sex (29% male vs. 36%) or politics (means of 2.8 vs. 2.6 on a 5 point scale of liberalism). Twenty-eight of the interview subjects were contacted for follow-up interviews. These interviews were directed at two issues. The first issue concerned the difference between worry and expected disutility (probability times badness). We wanted to know why people worry about risks that they perceive as not bad or not very probable, and why they fail to worry about risks that they perceive as likely and serious? We thus looked for risks that were ranked high in worry and low in expected disutility, and vice versa. Four risks for the worry vs. the expected-disutility question were selected as follows: the probability was multiplied by the badness rating for each risk and the resulting expected-disutility estimates were ranked; the worry ratings were also ranked; the ranks were subtracted, with the two highest and two lowest (most negative) differences selected for follow-up questioning (with arbitrary choices made in the case of ties). The second issue concerned the difference between personal and government responsibility for risk reduction. The interviewer selected (arbitrarily) two of the risks with the greatest discrepancy favoring government action, and two with the greatest discrepancy favoring personal action.
| Pers. | Gov't | Pers. | Avg. | ||||
| Worry | action | action | risk | risk | Cert. | Scope | |
| Pers. action | .5768 | ||||||
| Gov't. action | .3663 | .4861 | |||||
| Pers. risk | .4546 | .4066 | .2786 | ||||
| Avg. risk | .4198 | .4095 | .3209 | .6448 | |||
| Certainty | .1557 | .1818 | .1102 | .1316 | .2118 | ||
| Scope | -.0460 | -.0157 | .1430 | -.0423 | -.0165 | .0646 | |
| Badness | .1411 | .1274 | .1456 | -.0408 | -.0200 | .0237 | .1496 |
| Dependent variable: | |||||
| Personal | Personal | Gov't. | Gov't. | ||
| action | action | action | action | Worry | |
| Predictor | |||||
| Worry | .444 | .256 | |||
| Pers. Prob. | .134 | .325 | .428 | ||
| Avg. Prob. | .179 | .300 | |||
| Badness | .051 | .107 | .068 | .102 | .147 |
| Certainty | .083 | .139 | (.008) | (.030) | .107 |
| Scope | (.004) | (.004) | .150 | .125 | (-.023) |
1. Where have you heard about this risk? Do you know people who have experienced it? Have you heard about it in the news? In movies or TV shows? 2. Do you remember hearing or reading any statistical information about this risk? 3. Why do you worry (not worry) about this risk?Almost all subjects mentioned news or TV for every risk. We looked for a difference between worrisome and non-worrisome risks in terms of personal experience and knowledge of statistics. We might expect people to worry more when they have personal experience (or know someone who had such experience). The relation between recalling statistics and worry could go either way. People might worry more about risks that they have heard more about, or find their worries allayed by statistical information. In fact, both responses were more frequent for worrisome risks. Subjects mentioned statistics for 52% of the most worrisome risks and for only 32% of the least worrisome risks (z=2.52, p=.0116, Wilcoxon test). And they said they had knowledge of personal experience for 40% of the most worrisome risks and 31% of the least worrisome risks (z=2.06, p=.0397). In response to the questions about reasons for worry (or not), Table 7 shows the percent of subjects giving each of several reasons for worrying or not worrying.
| Reason | Worry | Not worry |
| Personal control | 4 | 32 |
| Personal lack of control | 21 | 25 |
| Government control or lack | 7 | 7 |
| Lack of knowledge | 11 | 0 |
| Probability overall | 29 | 18 |
| Probability for self | 18 | 64 |
| Bad or not bad | 36 | 11 |
| "Social problem" | 11 | 0 |
| Personal experience | 21 | 0 |
1. Why do you think that government should (should not) try to reduce this risk? 2. How much do you think that individuals can reduce the probability and magnitude of this risk? 3. How much do you think that government can reduce the probability and magnitude of this risk?It was difficult to find risks in both categories for everyone, since our sample tended strongly to favor government responsibility. (Although they were predominantly "middle of the road" politically, most residents of West Philadelphia, both students and nonstudents, tend to vote Democrat and favor government action.) Still, we could classify risks roughly in terms of attitudes about who should control them. Of course, we did not classify all the risks in the study because we asked each subject only about four. Attitudes toward who should reduce the risk were most strongly justified in terms of who could control it most easily. The largest category included risks that subjects felt should be dealt with by government because the government could control them and individuals could not: pesticides, cancer from food additives, contaminated food, vaccines, new diseases, AIDS from causes other than sex, chemicals in air and water, air pollution, nuclear radiation, airplane accidents, floods, war, and asteroids. A few risks followed the opposite pattern, with respondents feeling that government should play a lesser role in reducing the risk because individuals had more control over the risks than government: fires and accidents in the home, unhealthy diet, lightning, and tornadoes. For these risks, subjects tended to say that individuals were "responsible" for control as well as saying that they could control the risk more easily. For other risks, subjects said that both the government and the individual could control the risk, and, in these cases, they typically said that the government should control it: auto accidents, drugs/alcohol, AIDS from sex, and hurricanes. For example, individuals can drive safely, but government can enforce speed limits. In response to the question about why government should control the risk, many answers referred to the seriousness of the risk rather than the relative ease of control, e.g., "There is too much drunk driving and it destroys family life." Some risks fell into a mixed category, with subjects responding differently from each other: crime, accidents at work, radon gas, earthquakes (where some respondents said that nobody could do anything). For example, two subjects said that government can educate people about radon, but another subject said that government cannot do much and that this is up to homeowners. It is interesting that, for almost every risk, one could argue that both the individual and the government could do something. This is particularly true when we count as individual actions voting and giving money to causes - as some subjects explicitly did for malnutrition and war - and when we count education of individuals as a function of government - as subjects did for unhealthy diet and radon. Yet despite this possibility, 38% of the answers indicated that the individual and government had little or no control over the risk. In general, subjects seemed unaware of some of the possibilities for both the individual and the government to take action to reduce risks. The last question asked what protective behaviors the subject took, and, in particular, why she did not do anything to prevent risks with the highest expected disutility and why she did take action to protect against those with the lowest. Selection of risks for this question were not, however, systematic, and subjects tended to answer about risks discussed in other parts of the interview. Two subjects said they did not protect against any of the risks. Other subjects mentioned a variety of protective actions, e.g., avoiding fast food restaurants, avoiding pesticides, boiling water, using condoms, and getting a smoke detector. Subjects also mentioned not taking any protective actions against certain risks, because they thought that these actions were unnecessary, ineffective, or both. These include hurricanes, war, and bacterial infections and accidents at work. One subject did not want to protect against cancer from food additives because, "I "don't know what to do and don't want to give up foods I like, just in case." Another subject thought that protection against asteroids was unnecessary "because if they hit it is more likely they'll hit in a cornfield than in a city."