|
Commentary
SOUTH
ASIA
Time of reckoning for
the barons of development
|
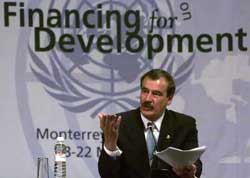
Mexican
President Vincente Fox addressing the Monterrey
Conference.
|
Leaders of
the institutions that guide global economic development have
set 2015 as a target date for reducing by half the number of
human beings who live in extreme poverty. The World Bank seems
to have launched this campaign and many institutions have
joined, including inter- national NGOs like OXFAM and CARE and
national agencies like Britains Department for International
Development. A United Nations conference met recently in
Monterrey, Mexico, to rally support for this exercise. Those
most in-fluential in setting the global agenda for economic
development agree that reducing poverty must be the top
priority and that reducing extreme poverty immediately is
imperative. 2015 symbolises their seriousness and sense of
urgency. If they succeed, life will improve for hundreds of
millions of people in the next 13 years.
Some
history might be useful for those in the public who would join
this campaign or seek to monitor its conduct and progress.
Poverty came to the fore in the global development agenda
during the 1990s, a decade famous for the rapid pace of
global- isation, when markets monopolised the minds that
planned our global future. The United States exemplified
fulsome free-market growth promoted by global develop- ment
institutions, led by the World Bank.
The
Economist (26 April, 2001) called the nineties probably the
most exuberant period of wealth creation in human history,
and showed how the bulk of new wealth came into the hands of
the rich. Millionaires and billionaires multiplied, and by
2001, the richest one percent of the world population came to
hold a third of the worlds wealth. More than half the worlds
425 billionaires live in the US, which exemplifies trends in
global in-equality. Between 1977 and 1999, the richest 20
percent of American households in-creased their share of
national income from 44 percent to 50 percent, and the richest
1 percent increased their share six times more, from 7 percent
to 13 percent. In America and around the world, the economic
boom accomplished very little poverty reduction and it
actually worsened extreme poverty. The most severe new poverty
fell on Africa, where average households now consume 20
percent less than 25 years ago.
The
nineties epitomised and aggravated a much longer trend. In a
study for the World Bank, aptly entitled, Divergence, Big
Time, Lant Pritchett calculated that between 1870 and 1985,
ratios of per capita income between the richest and poorest
countries increased more than six-fold, as income levels
dispersed over an ever-widening range of variation and the
richest and poorest eco- nomies clustered on opposite ends of
a broader spectrum. The 1992 UN Human Development Report
indicated that global inequality accelerated in the 1970s and
1980s (see chart).
The
campaign to reduce ext- reme poverty by half before 2015 thus
came into being as the worlds public was about to learn that
the poorest of the poor have been steadily increasing as a
proportion of the world population at the same time as the
richest of the rich have been steadily amassing an ever-larger
proportion of the worlds wealth. Global economic growth has
benefited people and places roughly in proportion to the size
of their portfolios and attractiveness for investors. In the
1990s, people in the Silicon Valley and Wall Street got hugely
rich but people with nothing to invest, in places with nothing
to offer investors, made nothing.
Inequality
grows during periods of economic growth, and poverty persists
and deepens, despite growing overall pros- perity, in part
because investors move assets out of less attractive places
into better-endowed places that become more attractive for
more investors; and in part because inve- stors reap more than
low-wage earners who see the cost of living rise faster than
wages. People with low incomes in risky, vul-nerable, insecure
areas inhospitable to capital investment lose out when
economic growth is driven solely by market decisions.
Share of
Global Income for the Richest 20%
and Poorest
20% of World Population |
| Year |
Share of Richest 20% |
Share of Poorest 20% |
Ration of Richest to
Poorest |
| 1960 |
70.2% |
2.3% |
30 to
1 |
| 1970 |
73.9% |
2.3% |
32 to
1 |
| 1980 |
76.3% |
1.7% |
45 to
1 |
| 1989 |
82.7% |
1.4% |
59 to
1 | |
Despite
the fact that markets do not eliminate poverty, because they
tend to move new wealth away from poor neigh- bourhoods, most
NGOs and governments follow market doctrines. They secure
dividends by concentrating investments in relatively
favourable environments. The poorest people in the poorest
places have thus disappeared in practice if not in ideology
and publicity from NGO net-works and government programmes,
almost as surely as they vanished from private marketing
surveys and business plans.
Increasing
inequality and extreme poverty strain the legitimacy of global
development institutions. The leaders of global development
live in rich countries. They depend on rich country
contributions. They follow rich country policies. They
nonetheless strive to benefit everyone in the world, rich and
poor alike. They believe that market-led economic growth is
the best route to prosperity for all. A boom decade like the
nineties is a good test of this belief. If economic success
such as registered in the nineties coincides for too long with
growing wealth disparity and abject poverty, their reputation
must eventually suffer.
2015 is
thus a deadline of significance. It represents an effort to
valourise the current leadership of global development regime
amidst increasing polarisation of rich and poor.
In a world
of globalisation, the possibility that world political
institutions may someday represent poor people in pro- portion
to their numbers makes this po- larisation ominous. Rich
country leaders represent a shrinking global elite minority.
OECD countries shrank as proportion of world population from
20 percent in 1960 to 15 percent in 1993. A mere ten percent
of the worlds people live in twelve countries with over USD
20,000 per capita GDP, mostly in the US (45 percent), Japan
(21 percent), Germany (14 percent), and France (10 percent).
Eighty percent of the worlds people live in 36 African and 19
Asian countries with under USD 1000 per capita GDP, large
proportions in China (34 per-cent), India (26 percent),
Indonesia (5 percent), Pakistan (4 percent), Bangladesh (3
percent), Nigeria (3 percent), Viet Nam (2 percent), and
Philippines (3 percent).
Most of
the global public lives in coun- tries where the 2015 campaign
will operate. Experience in those countries should enter
directly into global debates about economic development. Rich
countries now control the lions share not only of world
wealth but also of world knowledge. The best facilities for
studying the world are in rich countries. The US has a dozen
libraries each holding more books about South Asia than reside
in all the major libraries in South Asia combined. Most
funding to study the condition of the world is in rich
countries, where the most prestigious, well-funded academic
paradigms emerge for economic and policy analysis as well as
for historical and cultural studies. The assessment and
monitoring of the 2015 campaign should move in the opposite
direction.
The people
of South Asia should not only join in the institutional
partnerships that will advance the 2015 campaign, but also
hold the leaders of global development regime accountable for
the campaigns success. Representatives of international
development agencies operating in South Asia should engage the
public in open dialogue about the conduct of this cam- paign
and about the features of free-market globalisation that the
campaign seeks to ameliorate.
David
Ludden |