Part II – PUNNETT SQUARES
Student Misconceptions based on research:
- Alleles can be equally dominant (codominant) or show a blend of both alleles (incomplete dominance).
- Meiosis and Punnett squares only apply to sex cells.
Goals:
- Students will understand how meiosis is connected to Punnett squares.
- Students will understand that Punnett squares show the possible genotypes that result from fertilization.
- Students will become familiar with the related vocabulary.
Objectives:
- Students will be able to correctly set-up and complete a Punnett square.
- Students will be able to determine the phenotype and genotype of an organism.
- Students will be able to determine all the possible genotypes when a sperm fertilizes an egg.
- Students will model the process of genetic inheritance.
Background Knowledge:
- Students will have an understanding of mitosis and meiosis and how they relate to cell formation.
- Students will be familiar with Gregor Mendel and his studies and contributions to genetics.
- Students need to have an understanding of probability, the chance of an event occurring.
- Students need to be familiar with the equality of fractions, decimals, and percents.
Anticipation of Questions:
- What does meiosis have to do with Punnett squares?
- Why would we we need to use Punnett squares?
- Does it matter where we put the alleles in a Punnett Square?
Vocabulary to be introduced at the appropriate time:
- Genotype
- Phenotype
- Dominant Alleles
- Codominant
- Incomplete dominance
- Recessive Alleles
- Homozygous
- Heterozygous
Materials:
- 2 copies per student - “Meiosis, Fertilization & Punnett Squares”
- Extra copies of “Meiosis, Fertilization & Punnett Squares” for practice/homework
- 1 copy per student - “Chapter 3 Performance Based Assessment”
- per group – 4 plastic eggs (2 of 2 colors, ex. 2 pink, 2 blue)
8 jelly beans (4 of 2 colors, same colors as the plastic eggs)
Motivational Questions:
- Can you find one trait that you have in common with your mom/dad? Do your siblings, if you have any, have that same trait? Does one of your mom’s/dad’s parents have that trait?
- When you have children do you think they will inherit that same trait too? Why/why not?
- What do you think the chances are that your child or your next sibling will have that same trait? How do you know?
Introduction:
Before we begin today’s lesson you will take a self-graded true/false quiz to see if you remember some key points of meiosis:
- Meiosis happens only with sex cells. (true)
- The sex cells, sperm or egg, have the same number of chromosomes as all other cells in the body. (false – they have half)
- Two daughter cells are formed from meiosis. (false - 4 daughter cells)
- The daughter cells are new sperm and eggs. (True)
- In meiosis, the chromosomes make copies twice. (false – they copy once)
- In meiosis, the cell splits twice. (true)
Today you will learn how to figure out the chances of offspring looking like their mother, their father, sometimes a combination, or sometimes why they do not look like either parent at all. Today you will learn how to keep track of all the possible gene combinations two parents could produce, and you will learn how that can affect the offspring’s appearance. You will also show your understanding by modeling how genes could be inherited using plastic toy eggs and jellybeans.
Procedures:
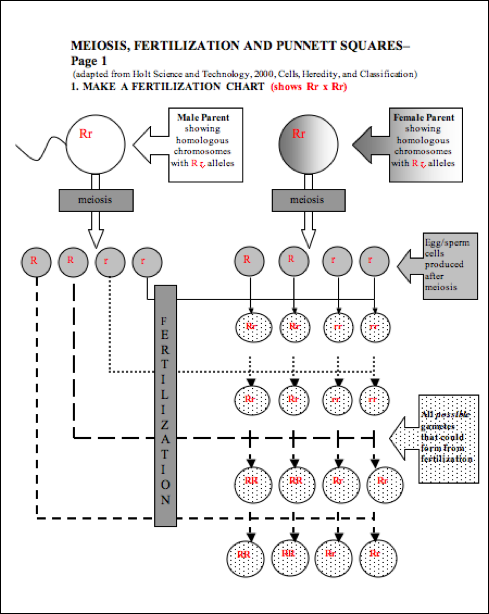
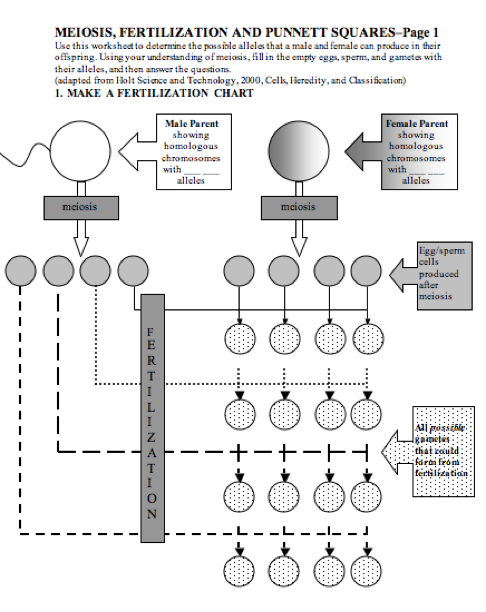
1. Show students the following transparency of meiosis and fertilization, revealing one step at a time and explaining each step as follows:
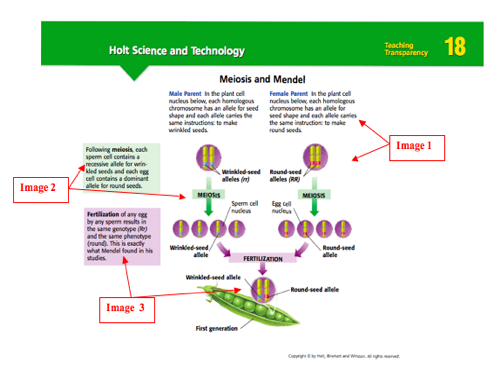
2. Image 1 - Male and Female Parents: Reveal this portion of the transparency. Explain that the male parent has two alleles, one from his mother and one from his father, and the same goes for the mother; alleles are different versions of the same gene;. Explain that the father inherited the recessive alleles (rr) from his mother and father and the mother inherited the dominant alleles (RR) from her mother and father. Those dominant and recessive alleles mean something very important. They tell the body what trait to show. In this case the female has instructions to be round (RR). The male has instructions to be wrinkled (rr). The alleles, RR or rr, are known as the genotype (the inherited combination of alleles). The physical appearance is the phenotype (what the gene combination causes the organism to look like). It is important to note that there is one other genotype combination, Rr. If a parent had these alleles, he would also be round.
Class
Question #1: Knowing this, which allele gets expressed, the R or the r? (R)
Class
Question #2: What do you think happens to that other allele that does not get
expressed, the r? (It stays within the cell, waiting to get copied during
meiosis and may get passed on to the offspring. This will be discussed further
in one of the next steps.)
Class
Question #3: Are things always expressed as one extreme or the other? (no) Give examples. (Dark x light =
tan or long x short = medium)
Explain that sometimes neither allele will be dominant and instead there will be a blend of the trait. That is called incomplete dominance, and the genotype will still be Rr. Sometimes both alleles will be dominant and express both traits at the same time. This is called codominance, and has the genotype Rr as well.
3. Image 2 - Meiosis:
Reveal this portion of the transparency. Have students tell what happens during
meiosis that makes one egg /sperm cell result in 4 daughter cells. Reiterate
that the two chromosomes in the parents’ cells get duplicated and separated to
make 4 daughter cells. The daughter cells contain exact copies of the
chromosomes that their parents had, which include exact copies of the alleles,
or the directions of how the organism will look. So the father has daughter
cells of r r r r and the mother has daughter cells of R R R R. They are all r and R because that is
all that the parents had, and an exact copy was made.
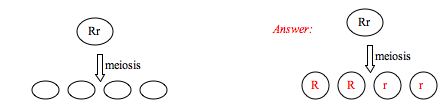
Class
Question #4: (Draw the following diagram on the board.)What would the daughter
cells look like if the parent was Rr? ( R R r r)
4. Image 3: Reveal this portion of the
transparency. Explain that in this step, only one of the sperm possibly will
fertilize one egg. If fertilization happens, then one of the father’s daughter
cells will combine with one of the mother’s daughter cells. Since the father
only has r alleles in his daughter cells then the r allele will be passed on to
their offspring. Since the mother only has R alleles in her daughter
5. Next,
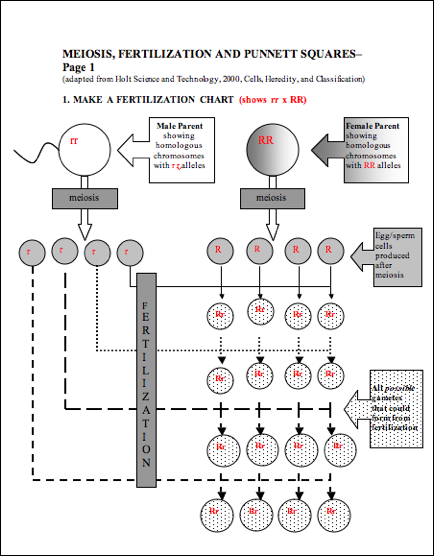
distribute the worksheet “Meiosis, Fertilization & Punnett Squares”. Model with students parts #1-4 for the
cross shown on the transparency, rr x RR (Answers are shown below in red).
The
“Fertilization Chart”, #1, should
help the students trace what happens during fertilization. The end result will
be 16 possible gametes that should be labeled with their inherited alleles from
the two parents at the top. It is important to emphasize that this chart
shows ALL POSSIBLE combinations from fertilization. This is important now and also when explaining the Punnett Square on
page 2. True fertilization will only produce ONE of these possibilities.
Answers:
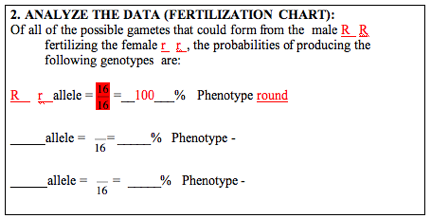
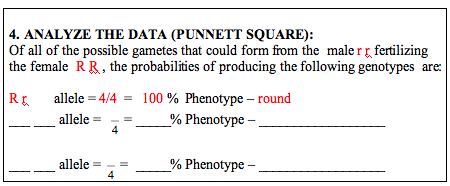
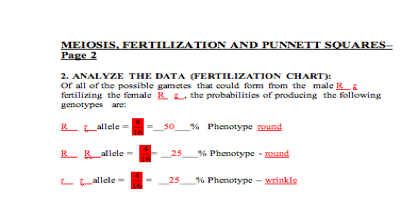
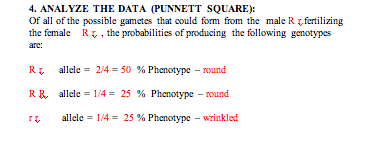
6. Now have
students complete #2-Analyze the Data (Fertilization Chart) to compile the
results from the chart.
Class
Question #5: If the mother passes on the R allele and the father passes on the
r allele, then what is the genotype of the offspring? (Rr ) What is the phenotype? (round)
Class
Question #6: Are there any other combinations of alleles that this mother and
father could give to the offspring? Why/why not? (No, there are no other
combinations b/c the mother could not contribute any other allele besides R,
and the father could not contribute any other allele besides r. OR The mother’s
and father’s daughter cells only have R’s and r’s, respectively, so no other
combination is possible.)
Answers:
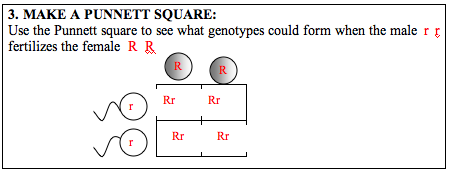
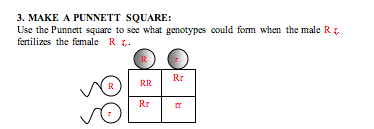
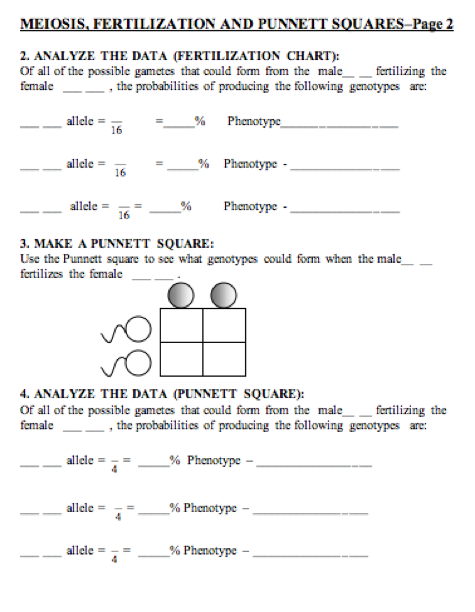
7. Now complete
#3-Punnett square with the students. Tell students that biologists use Punnett
squares when studying genetic traits. Instruct students in the steps of how to
set-up and complete a Punnett square.
(adapted
from the State of Utah Office of education Website http://www.usoe.k12.ut.us/curr/science/sciber00/7th/genetics/sciber/punnett.htm)
Step
1. Designate letters that will represent the genes/traits. Capital letters
represent dominant traits, and lowercase letters represent recessive traits. R
= round r = wrinkled RR (round) /
rr (wrinkled) - both homozygous (same) or
purebred
Rr
(round or somewhere between
round and wrinkled) – heterozygous (different)
Step
2. Write down the genotypes (genes) of each parent. These are often given to
you or are possible to determine.
Step
3. Draw a Punnett square – Draw a square and divide it into 4 sections.
Write the possible gene(s) of one parent across the top and the gene(s) of the
other parent along the left side of the Punnett square.
Step
4. Fill in each box of the Punnett square by transferring the letter above and
in front of each box into each appropriate box. As a general rule, the capital
letter goes first and a lowercase letter follows.
Step
5. List the possible genotypes and phenotypes of the offspring for this cross. Answers:
8.
Complete #4 with the students, “Analyze the Data (Punnett Square)”. Answers:
Thought:
Students should notice that the Punnett square shows the same results as the
“fertilization chart”. If they have not said so, the next set of questions
should force them conclude this.
9. Give students
another copy of pages 1 and 2 of “Meiosis, Fertilization, and Punnett Squares”.
In groups of 2 or 3, have students complete #1-4 to show the offspring when the
first generation would self-pollinate (show a cross of Rr x Rr). Walk around the room to assist students. If
time permits, students can investigate a cross from the second generation or
any other cross they are interested in.
Answers:
Answers
10. Students
should now complete #5 of the
“Meiosis, Fertilization, and Punnett Squares” worksheet. At this point,
students should be able to grasp the connection between Punnett squares, fertilization,
and meiosis.
5. ANALYZE THE RESULTS Answers
Answer the following questions after completing the fertilization chart
and a Punnett square.
a. How did the data from the Punnett square compare to
the data from the fertilization chart? It was the same
data, just shown in different forms.
b. What does the fertilization chart allow you to see?
All the possible combinations of alleles that an egg
and sperm could produce and how many of each.
c. What does the Punnett square allow you to see? The different
combinations of alleles that parents can produce
d. How are the fertilization chart and the Punnett
square similar? different? They are similar because
they both show the probability of the alleles in the offspring. They are
different in the amount of time it takes to complete them; the Punnett square
is much more simple.
e. How is meiosis connected to a Punnett square? Meiosis gives you the daughter cells that could possibly become fertilized, as
illustrated in the fertilization chart. They form the same offspring that are
shown in a Punnett square. The Punnett square is a shortcut for seeing the
possible alleles that could form.
f. If you had to find all the possible genotypes that
could be produced from a sperm and egg fertilizing, would you complete a
fertilization chart or a Punnett square? Why? I would
choose a Punnett square because it is quicker to complete./ I would choose a
fertilization chart because it is more specific and shows exactly how
fertilization works.
Thought:
Use the answers students provide as an informal assessment to determine their
level of understanding.
Conclusion/Wrap-up
Students
will discuss the answers to the questions from the “Meiosis, Fertilization
& Punnett Squares” worksheet.
Students will also discuss any confusion they may have concerning creating Punnett squares and how they relate to meiosis and
fertilization. The purpose of the
activity must be discussed. The
teacher may ask the students the questions presented In the beginning of the
activity to demonstrate students understanding of the lesson. The questions were as follows:
- Can you find one trait that you have in common with your mom/dad? Do your siblings, if you have any, have that same trait? Does one of your mom’s/dad’s parents have that trait?
- When you have children do you think they will inherit that same trait too? Why/why not?
-
What do you think the chances are that your child or
your next sibling will have that same trait? How do you know?
By
refocusing the questions at the end of the lesson, students will demonstrate
the level of understanding that they have achieved from this lesson.
The
next step to take in the process is taking this information and seeing how
Punnett Squares can help students keep track of the terms when squaring binomials
in math class.
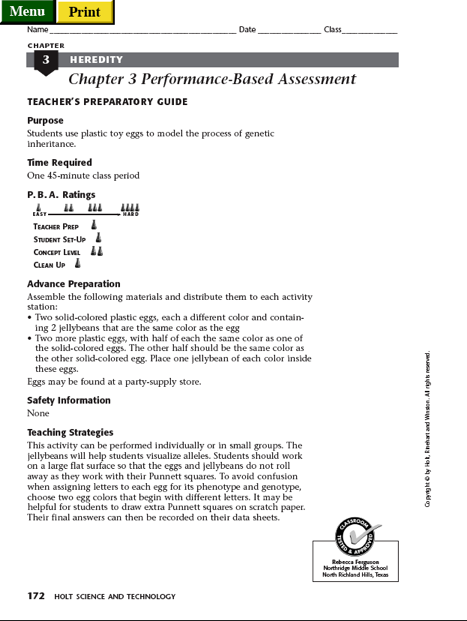
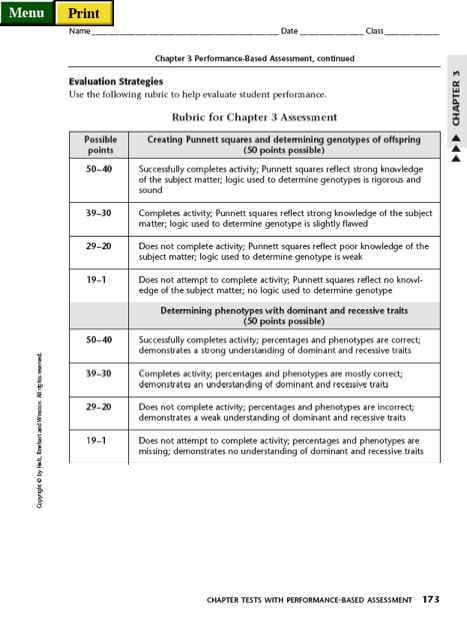
Assessment
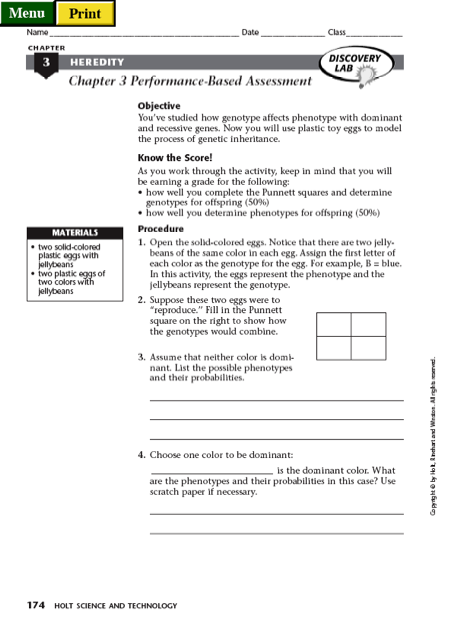
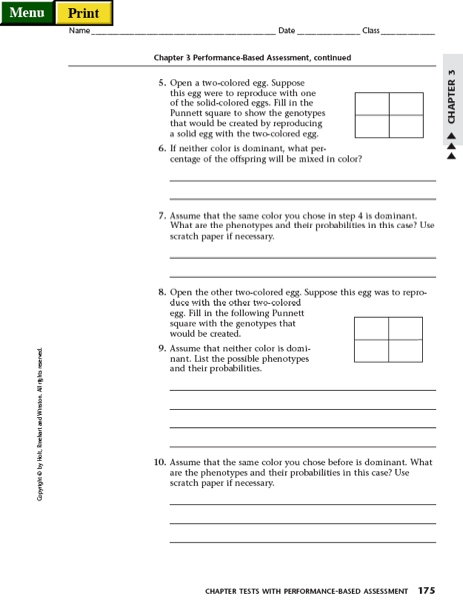
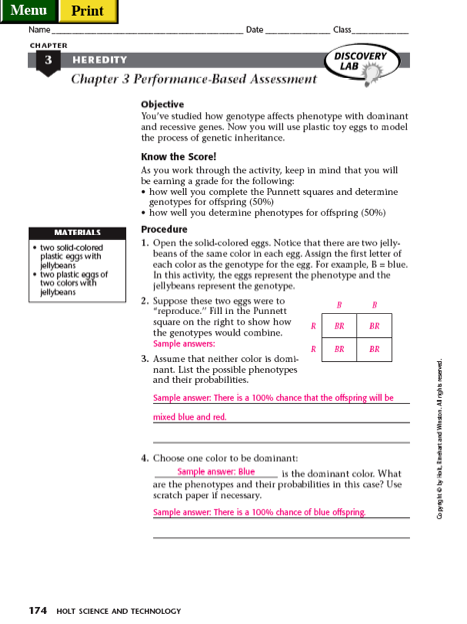
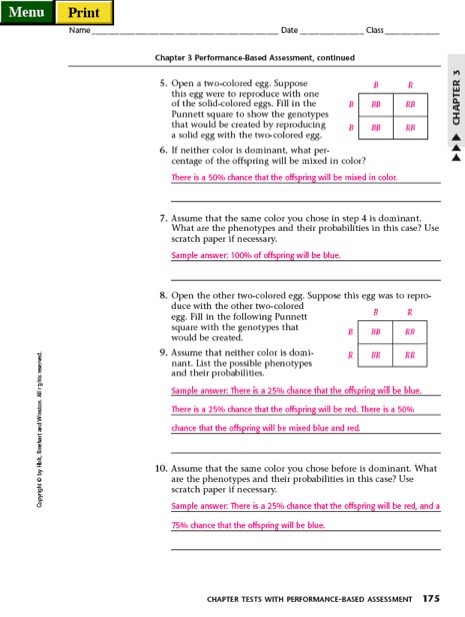
Have
students complete the fertilization activity: “Chapter 3 Performance Based
Assessment” Use the results of the assessment to guide further
instruction/remediation/reinforcement. A scoring guide is included in the activity
pages.
From
Holt Science and Technology, 2000, Cells, Heredity, and Classification
MEIOSIS, FERTILIZATION
& PUNNETT SQUARES–Pg 3
5. ANALYZE THE RESULTS
Answer the following
questions after completing the fertilization chart and a Punnett square.
a. How did the data from the Punnett square compare to
the data from the fertilization chart?
b. What does the fertilization chart allow you to see?
c. What does the Punnett square allow you to see?
d. How are the fertilization chart and the Punnett
square similar? different?
e. How is meiosis connected to a Punnett square?
f. If you had to find all the possible genotypes that
could be produced from a sperm and egg fertilizing, would you complete a
fertilization chart or a Punnett square? Why?