The Institute of Pennsylvania Hospital and University of Pennsylvania
Stanford University
College of Physicians and Surgeons, Columbia University
Stanford University
Stanford University
The Institute of Pennsylvania Hospital and University of Pennsylvania
The Institute of Pennsylvania Hospital and University of Pennsylvania
Columbia University
Abstract: Measures from the clinically derived Hypnotic Induction Profile (HIP) of Spiegel (1974a) were correlated with those from the
Manuscript submitted December 24, 1977; final revision received March 27, 1979.
1 The research reported by the Philadelphia laboratory was supported in part by grant #MH-19156 from the National Institute of Mental Health and by a grant from the Institute for Experimental Psychiatry. The research reported by the Stanford laboratory was supported in part by grant #MH-03859 from the National Institute of Mental Health.
2 Herbert and David Spiegel would like to acknowledge the consultation of Joseph L. Fleiss and Helena C. Kraemer and the assistance of Donnel B. Stem, Brian L. Maruffi, and Mark J. Trentalange who participated in the assessment of the data.
3 Now at the University of Wyoming, Laramie, Wyoming.
85
86 ORNE ET AL.
laboratory derived Stanford Hypnotic Susceptibility Scales, Forms A and C (SHSS:A, SHSS:C) of Weitzenhoffer and Hilgard (1959, 1962), and with some scores from the related Harvard Group Scale of Hypnotic Susceptibility, Form A (Shor & E. Orne, 1962). Ss were paid volunteers from student populations at the University of Pennsylvania (N = 87) and from Stanford University (N = 58). Some differences in sampling procedures and orders of testing are discussed, but only minimal differences between the 2 samples resulted. Positive but nonsignificant correlations were found between the Eye-Roll sign alone and SHSS in the 2 samples. Both the Induction (IND) and Profile scoring methods of HIP were compared with SHSS. The IND, an actuarial scale, was positively correlated with SHSS. A representative value is the significant correlation of .34 between IND and SHSS:(A + C)/2 scores when the 2 samples were pooled together. Dichotomized scores of the nominal Profile configurations score (intact versus nonintact) corresponded significantly by appropriate chi square analysis with both the dichotomized IND scores and the dichotomized SHSS scores. The results indicate that HIP, even when applied outside of its usual clinical context, was found to have a moderate relationship with SHSS.
A new clinical test for hypnotizability, involving a novel Eye-Roll sign, hypothesized to be a measure of biological capacity for hypnosis, combined with a more traditional trance induction test, was announced at the 1970 annual meeting of the American Society of Clinical Hypnosis, with impressive evidence from 2,000 consecutive patients who had had their trance states graded on the 10-minute Hypnotic Induction Profile (HIP) (H. Spiegel, 1972). The HIP manual was published the same year (H. Spiegel & Bridger, 1970), and has been revised twice since then (H. Spiegel, 1974a; H. Spiegel & D. Spiegel, 1978a).
The Hypnotic Induction Profile was developed on a clinical population of psychiatric outpatients for the purpose of enabling the clinician to rapidly assess the relevance of hypnosis in the treatment of various psychiatric problems for a given patient (H. Spiegel, 1977). Spiegel emphasized the brevity of the HIP as making it a convenient and appropriate means for clinicians to assess hypnotizability systematically. "In 5 to 10 minutes the Hypnotic Induction Profile measurement can provide the clinician an opportunity to grade this capacity with sharper focus and more certainty [H. Spiegel, 1972, p. 27]."
In the HIP, stress is placed upon the Eye-Roll (ER) sign as a measure of a physiological or structural, rather than a psychological trait which is "responsible for a person's potential to experience trance [H. Spiegel, 1977, p. 130]." Spiegel's data indicate a relationship between a positive (1.0 to 4.0) or zero ER and the presence or absence of clinically useable hypnotizability. However, this relationship is complicated by the hypothesized decline in hypnotic capacity resulting from the impairment
87 THE HIP AND SHSS:A AND SHSS:C
of concentration often associated with serious psychiatric illness. Spiegel's data suggest that when the ER is a false positive indicator of hypnotizability there is likely to be a higher incidence of severe psychopathology (H. Spiegel, Fleiss, Bridger, & Aronson, 1975; H. Spiegel, Stern, & Maruffi 4).
The second part of the HIP concerns itself with a trance induction test and, when the ER is not considered, measures phenomena which have long been recognized as belonging to hypnosis: involuntary motor responses, concentrated or divided attention, and dissociated subjective experiences. The HIP was devised for the clinical purpose of identifying which psychotherapy patients could be expected to obtain the most benefit from hypnotic strategies. The longer laboratory scales of hypnotic responsiveness, the Stanford Hypnotic Susceptibility Scales, Forms A and C (SHSS:A and SHSS:C) prepared by Weitzenhoffer and Hilgard (1959, 1962) were devised as research instruments. Whatever one's theory about hypnosis, the domain that defines what is commonly accepted as hypnotic performances and experiences is hardly controversial (Hilgard, 1973). In the HIP the acceptance of this domain is evident in most of those items which are independent of the ER and associated chiefly with arm levitation. The discovery experiences of dissociation and differential control in one hand are not specifically instructed but are inferred by the subject and reported later. This is unusual in testing for hypnotizability. It is a measure of various aspects of one continuous, brief, hypnotic experience. More particularly, the experiences that characterize the very highly hypnotizable, known as the Grade 5 on the HIP (H. Spiegel, 1974b) are the kinds tested in longer hypnotic scales, such as the SHSS:C and Stanford Profile Scales, Forms I and II (Weitzenhoffer & Hilgard, 1967), the scores of which correlate with one another and the SHSS:A. The following quotation indicates this relationship between the highly hypnotizable, as conceived by H. Spiegel and as conceived by those who designed the other standard scales, and by society at large:
Those subjects whom the literature refers to as classic somnambulists or deeply hypnotizable individuals are Grade 5's. In terms of initial measurement, a Grade 5 is a Grade 4 whom additional testing [emphasis added] reveals to have such epiphenomena as experiencing age regression in the present tense, sustained bizarre posthypnotic motor alterations and posthypnotic hallucinatory responses to a cue; and/or global amnesia for the entire hypnotic episode. This group comprises not more than 10% of the population [H. Spiegel, 1974b, p. 304].
88 ORNE ET AL.
It should be noted that the additional testing to which reference is made is not done routinely. In the ordinary Profile Grade scale, the Grades 4 and 5 are expected to appear together as Grade 4. Hence, for research purposes in which it is desirable to maximize the distinctions among subjects, the HIP of those 12 % of subjects who score a Grade 4 (H. Spiegel et al., 1975) must be supplemented by tests of the above-mentioned items. However, the HIP was developed more for the purpose of identifying intact hypnotizability for clinical purposes than for distinguishing among highly hypnotizable subjects.
Spiegel et al. (1976) have reported on the reliability and construct validity of the HIP. The main sample consisted of an unselected population of 1674 patients. A factor analysis showed that the HIP measured two factors instead of one. When rotated, the factor in which the ER loaded a high .92 (maximum possible = 1.00) was separated out from the hypnotic induction factor (IND) on which the ER loaded an insignificant .08. This means that the ER is unrelated to the hypnotic induction factor in the total sample. The raw correlations that entered into the factor analysis showed the ER to correlate below .20 with 6 of the 9 individual items (other than up-gaze which was related to it .77); the highest correlation with something independent of an ER was .37 with initial arm levitation. The obtained correlation between ER and the IND was .22. It is evident that, whatever the ER measures, within an unselected patient population, it is not highly correlated with measured hypnotizability.
Recent reports by H. Spiegel and his collaborators emphasize that the ER alone is not a measure of hypnotizability per se, but rather of the presumed capacity to experience hypnosis. This capacity may be interfered with by various kinds of psychological, pharmacological, and neurological disturbance. Therefore, the ER would not be a useful indicator of hypnotizability if measured out of the context of the entire HIP, which is needed for an estimate of clinical hypnotizability. These reports also seem to indicate that the ER may be useful for other purposes in relation to the diagnosis of psychopathology or as a guide to appropriate psychotherapeutic procedures in addition to its use as an indicator of inherent trance capacity. This is a separate issue which the present investigation has not addressed. The two issues are readily confused, and in the interest of clarity it is desirable to study them one at a time, after which any interactions between them will be better understood.
The investigation reported here was carried out in two parts. The earlier was conducted at the Unit for Experimental Psychiatry at The Institute of Pennsylvania Hospital, and was initially intended to evaluate the HIP in a group of 87 subjects whose hypnotic responsivity was stable
89 THE HIP AND SHSS:A AND SHSS:C
and had been carefully established by several investigators. Economic considerations made it necessary to administer the HIP after the hypnotic response had become stable. The administration and scoring of the HIP was carried out by Herbert Spiegel. Though the results were promising, before any general conclusions were justified, it was clearly essential to carry out an evaluation in the reverse order -- with the HIP preceding rather than following the other hypnotic assessment. A variety of practical considerations made the execution of the second part of the Pennsylvania study impractical. By mutual agreement it was decided to conduct this aspect at Stanford. Here the HIP was first administered to a sample of 58 subjects who were subsequently assessed with the aid of two independent Stanford Hypnotic Susceptibility Scales. The administration and scoring of the HIP were carried out by David Spiegel.
The combined investigation was intended to clarify objectively some of the questions raised in the earlier studies without commitment to any special theory about hypnosis and without any prejudgments as to the outcome.
METHOD
For the sake of brevity, those aspects of subject selection and procedure which were different in the Pennsylvania and Stanford studies will be described separately, followed by a description of those aspects which were the same for the two studies.
THE PENNSYLVANIA STUDY
Subjects
The Pennsylvania study involved 87 paid subject volunteers between the ages of 20 to 33 years, with a mean of 25.0, who had participated in previous experiments with the laboratory and demonstrated a consistent response to hypnosis over time. When initially solicited as paid volunteers by classroom announcements or advertisements, all subjects were students in local universities. Each subject had been administered an initial standardized scale -- either the SHSS:A or the group version, the HGSHS:A.5 This was always followed by SHSS:C, individually administered by a different experimenter. Further, each subject had at least two diagnostic ratings on the five-point clinical hypnotic rating scale described by Orne and O'Connell (1967), again administered by a different investigator. If there were inconsistencies in the subject's response, additional diagnostic sessions were administered by another ex-
90 ORNE ET AL.
perimenter to assure that subjects achieved a stable measure of plateau hypnotizability (Shor, Orne, & O'Connell, 1966).
Subjects had participated in a variety of studies with the laboratory over a period from one to ten years prior to this particular experiment. It was felt that using a sample of subjects who had achieved plateau hypnotizability would provide an opportunity to assess the relationship between the HIP and the more typical measures of hypnosis generally employed under the most favorable possible circumstances. Finally, because hypnotizability approximates a normal distribution, tapering off to a few cases at the upper and lower extremes, few individuals with extreme scores are usually seen in a relatively small sample, and, therefore, an effort was made to include subjects who scored both very high and very low in their hypnotizability ratings as assessed by the diagnostic rating scale.
Procedure
All subjects were asked to participate in an important follow-up experiment. The sample includes many individuals who had since graduated and now held responsible positions in business and the professions. The HIP was administered at the Unit by Dr. Herbert Spiegel over a three-day period. He was unaware of the subject's previous hypnotizability scores and saw each subject for approximately ten minutes, limiting his interaction to the administration of the HIP. In order to facilitate rapport, subjects had been led to anticipate an interesting, novel, and important experience. They particularly looked forward to meeting Dr. Spiegel since it was emphasized in the initial telephone discussion about the experiment that he was a distinguished visiting professor and an authority on hypnosis participating in an important collaborative effort. The purpose of this emphasis in the Pennsylvania study was to help approximate the kind of expectancies which a private patient would have after having made an appointment with a well-known clinician, thus creating a setting for the administration of the HIP more closely parallel to that where the normative data had been collected.
THE STANFORD STUDY
Subjects
The Stanford study was carried out with 58 paid volunteers, ranging in age from 18 to 34 years, with a mean of 22.9, who had responded to a university student newspaper advertisement. No subjects had previous hypnotic experience.
Procedure
The HIP was administered by David Spiegel as the first procedure and
91 THE HIP AND SHSS:A AND SHSS:C
was followed by the SHSS:A and SHSS:C administered by various trained experimenters in the Laboratory of Hypnosis Research. Individual testing occurred on three separate days, usually but not always consecutive. Experimenters were blind as to the scores received in any of the other sessions. Subjects were discouraged from talking about their HIP or SHSS experiences with other experimenters. In retrospect, differences between the procedures of the two studies were apparent. Unlike the Pennsylvania study, no attempt was made in the Stanford study to enhance motivation by approximating the atmosphere of the clinical setting. The importance of the study was not stressed nor were the examiner's qualifications and experience discussed.
If the scores of a group of college student volunteers are compared with a patient population, certain factors must be taken into consideration. Differences in age, socioeconomic status, psychopathology, and motivation for hypnosis are to be expected. In addition, the scales compared have been used primarily on different groups, and for different purposes. The HIP was designed and standardized on patients coming for psychiatric treatment and the other scales (HGSHS:A, SHSS:A, SHSS:C) have been standardized on college students, and studied largely in nonpatient populations. When they are administered in the laboratory, scores on these scales are usually the primary focus of attention. Because of the differences in populations and intended purposes of the scales, the question of their relationship is essentially an empirical one, to be determined by the distributions of the hypnotic responsiveness scores and their correlations when both scales are administered to the same subjects.
RESULTS
The Eye-Roll (ER) and the SHSS Scores
While the Eye-Roll Sign (ER) forms an integral part of the HIP, it should not be considered as a score related to hypnotizability by itself. It is a sign of a presumed capacity to experience hypnosis and is only meaningful when used in conjunction with the entire HIP. A detailed presentation of how to score the ER can be found in Spiegel (1972).
92 ORNE ET AL.
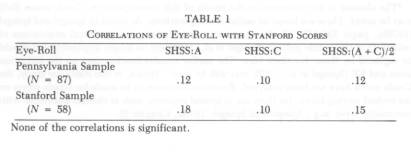
The relationships between the Eye-Roll sign (ER) and the SHSS are presented in Table 1. In both the Pennsylvania and Stanford samples the correlations, while positive in sign, are not statistically significant. These findings agree with the factor analysis that had shown the ER as a factor separate from the arm levitation measurements (Spiegel, Aronson, Fleiss, & Haber, 1976), and the findings of others (Eliseo, 1974; Switras, 1974; Wheeler, Reis, Wolff, Grupsmith, & Mordkoff, 1974). It is also consistent with the previously published hypothesis that the ER alone is not a measure of hypnotic potential in a population unscreened for the presence of psychopathology (Spiegel et al., 1975).
Scoring Methods on the HIP
There are two methods of scoring the HIP. One is the Induction Score (IND), which is an actuarial scale. It is an additive score related primarily to arm levitation and responses associated with it. The ER is disregarded in computing the IND, so that the IND corresponds most directly to the type of measurement used in the Stanford Scales.
The Profile scoring method is a configurational score. As used in this investigation, it is a dichotomized nominal score so that all subjects were classified as intact or nonintact. The intact-nonintact distinction is similar to a hypnotizable-nonhypnotizable distinction. However, different nominal categories within the intact-nonintact scoring system are used to identify clinically feasible hypnotizability. A detailed explanation of the IND and Profile scoring methods can be found in Spiegel and Spiegel (1978b).6
It is evident from Table 2 that the Pennsylvania sample differs very little from the patient sample (limited to those patients of approximately the same age as the students). The Stanford sample shows a significantly larger proportion of low scores than either the patient sample (x2 = 5.85, d.f. = 1, p<.02) or the Pennsylvania sample (x2 =4.91, d.f. = 1, p<.05). For this variable, the Pennsylvania sample does not differ from the patient sample (in a later comparison it will be shown that the Stanford sample is the one that does not differ).
93 THE HIP AND SHSS:A AND SHSS:C

It is a matter of some interest to find whether the differences between the Pennsylvania and Stanford samples may be a consequence of other differences in the samples, or may reflect in some manner differences in procedures or order of testing. Additional comparisons of the Pennsylvania and Stanford scores, including those on SHSS as well as IND are given in Table 3. The difference between the Pennsylvania and the Stanford samples are so slight as to be insignificant throughout, when the full range of data is taken into consideration.
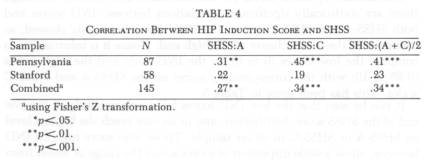
Correlations between IND and SHSS scores. The relationships between the IND and the SHSS scores are found in Table 4. By the usual
94 ORNE ET AL.
statistical conventions, the three correlations based on the Pennsylvania sample are all significantly different from zero, while the Stanford correlations fail by a few points to reach significance at the .05 level. However, the Stanford correlations do not differ significantly from the Pennsylvania ones, and when the two samples are combined (using Fisher's Z transformation [Snedecor & Cochran, 1967]), all correlations with SHSS:A, SHSS:C and the two tests combined are statistically significant; a representative correlation is that of .34 with SHSS: (A + C)/2.
It should be noted that SHSS:A and SHSS:C intercorrelate .77 and .65 in the Pennsylvania and Stanford samples respectively. This constitutes a ceiling on the correlations between the Induction scoring method of the HIP and SHSS, since one could not expect another test to correlate more than SHSS:A and SHSS:C do with one another.
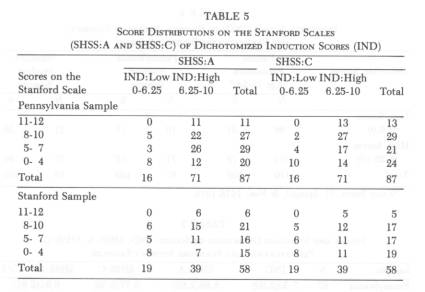
Distribution of SHSS scores for dichotomized IND scores. Although there are statistically significant correlations between IND scores and both SHSS:A and SHSS:C scores, the IND scores are highly skewed, so that most of the scores cluster at the high end. Hence it is informative to compare the low scores (0 to 6) on the IND scale and the high scores (6.25 to 10) with the corresponding scores on the SHSS:A and SHSS:C scales. This has been done in Table 5.
It can be seen that the low IND scores fall predominantly at the low end of the SHSS score distribution, and in no case reach the highest level on SHSS:A or SHSS:C in either sample. Those who score high on IND however, show a wide dispersion of scores across the range of scores from very low to very high on the Stanford Scales.
95 THE HIP AND SHSS:A AND SHSS:C
Intact and Nonintact Profiles and SHSS Scores
The final scoring method to be considered is the classification of the results of the HIP into intact and nonintact profiles. These classes are related to scores on SHSS:A and SHSS:C.
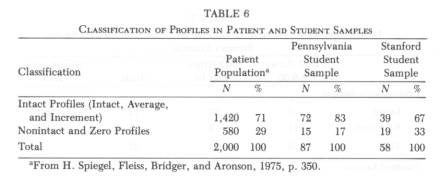
Distribution of Intact-Nonintact Profiles in the samples. The first question to be answered bears on the adequacy of the samples. Do the intact and nonintact profiles distribute in a common manner between a patient population and the student population being studied? The answer is supplied by Table 6.
The distributions of the patient sample and the Stanford sample are nearly identical. In contrast, the Pennsylvania sample shows significantly fewer nonintact and zero profiles than either the patient group (x2 = 5.09, d.f. = 1, p< 05) or the Stanford sample (x2 = 3.84, d.f. = 1, p<.05). Both here and in Table 2 the differences, while statistically significant, are not large. In any event, since the two samples are never combined (rather, results for the separate samples are averaged), the effects will be minimal on the interpretation of the results as they were on the relationship between HIP and SHSS.
Relationship between Intact-Nonintact Profiles and the ER. Because profile scores are related to the ER, the relationship needs to be clearly understood. Intact and nonintact profiles require an ER of 1.00 or greater, and in that manner are distinguished from zero configurations for which the ER is less than 1.00, and from IND scores in which the ER does not enter. In this investigation zeros were included with nonintact profiles, so that, empirically, the ER did not affect the classification into intact or nonintact profiles, that is, all subjects were placed in one or the other configurations without regard to ER. This inclusion of zeros among the nonintacts, while conceptually questionable, made little empirical difference, because in this general age group, zero ERs are expected in less than 2 % of the subjects (Stern, H. Spiegel, & Nee, 1978/1979). No zeros occurred in the Stanford sample, while four were found in the Pennsylvania sample, a total of 4/145 = 2.8%.
96 ORNE ET AL.
The basis for classification, therefore, was determined primarily by the presence of either zero Control Differential, or zero Signalled Arm Levitation, both also aspects of the IND. The main point is that the low correlation between the ER and the Stanford scores does not affect the relationship between the intact-nonintact profiles and the Stanford scores.
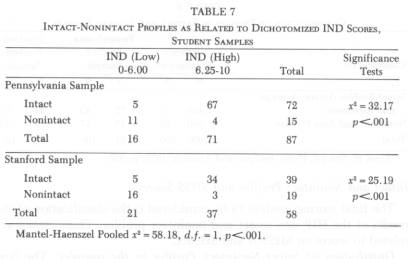
Relation between Intact-Nonintact Profiles and dichotomized IND scores. Examination of the previously presented Tables 2 and 6 shows that the dichotomization of the IND scores (0-6, and 6.25-10) yields proportions of high and low hypnotizables essentially the same as those produced by the intact-nonintact dichotomization. Because these scores are both derived from arm levitation, it is of interest to know how closely they are related. If the relationship is close, then they should both be similarly related to the SHSS scores. The appropriate data are presented in Table 7. It turns out that the two scores are indeed very closely related, as indicated by the highly significant x2 in the two individual samples as well as by the Mantel-Haenszel pooled x2 with one degree of freedom (Snedecor & Cochran, 1967). Hence, a positive relationship between intact-nonintact profiles and SHSS scores may be expected similar to that already demonstrated for the IND scores.
Intact-Nonintact Profiles and dichotomized SHSS scores. If the SHSS (A + C)/2 scores are dichotomized into categories of less and more hypnotizable, a comparison can be made with the intact-nonintact Profile configuration. For this purpose the division point on the SHSS: (A + C)/2 scores was selected to yield a division such that subjects in the combined
97 THE HIP AND SHSS:A AND SHSS:C
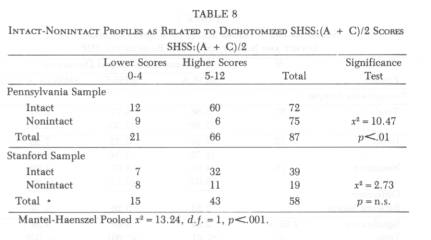
samples would most closely approximate the proportions of intact and nonintact profiles.7 This proved to be possible by assigning to lower hypnotizability those scoring 0 to 4, and to higher hypnotizability those scoring 3 to 12. The results are given in Table 8, separately for the two samples and for the pooled samples using the Mantel-Haenszel method.
As expected the results are quite similar to those obtained with IND scores. The relationship is significant within the Pennsylvania sample, not within the Stanford sample, but highly significant when both samples are combined using the Mantel-Haenszel method. However, significance tests alone may be quite misleading. Within both samples, intactness is highly related to the higher scores on SHSS: (A + C)/2. Of the 72 subjects classified as intact in the Pennsylvania sample and the 39 classified as intact in the Stanford sample, 60/72 (83 % ) and 32/39 (82 % ) are classified as high by their SHSS scores respectively. However, nonintactness is less predictive of lower scores on SHSS. Of the 15 subjects classified as nonintact in the Pennsylvania sample and the 19 subjects classified as nonintact in the Stanford sample, 6/15 (40%) and 11/19 (58%) received higher scores on SHSS respectively. Thus, the high x2 results from the intact classification, not from the nonintact one.
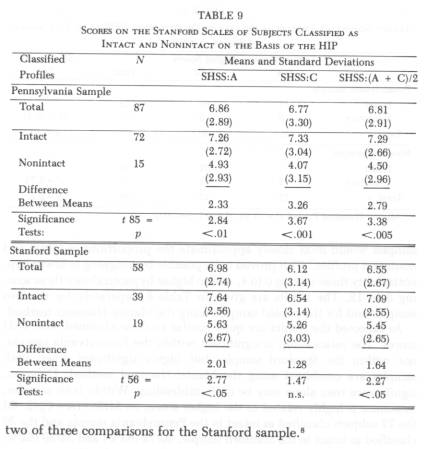
Another way of demonstrating that those with nonintact profiles score significantly lower on the Stanford scales than those with intact profiles is shown in Table 9. Here the SHSS:A, SHSS:C and SHSS: (A + C)/2 mean scores with their standard deviations, are presented for the intact and nonintact classifications. Consistent with the other analyses, the differences are significant throughout for the Pennsylvania sample, and in
98 ORNE ET AL.
SUMMARY OF FINDINGS
In this empirical comparison of the HIP and the SHSS scores it should be noted that the HIP was devised as an ancillary test in a clinical setting. These studies were conducted out of the ordinary context of its use and within the usual context of the SHSS, i.e., in the laboratory with unscreened volunteers. Critical issues such as motivational set and central vs. peripheral interest in the test situation were not investigated. The relationships between ER, psychopathology, and personality configurations were not examined. The ultimate clinical value of the ER sign cannot be evaluated until these relationships are explored.
99 THE HIP AND SHSS:A AND SHSS:C
In view of these considerations, throughout this report, and in this summary, areas of agreement and disagreement between the scores and configurations derived from the HIP, and those based on SHSS, are presented without attempting to explain the relationships as found. The differences that have been noted are not evaluated, except as they bear directly on the measurement of realized potential for hypnosis among university students.
The summary that follows refers directly to the data as presented in the statistical tables.
1. The distribution of scores on the HIP in two student populations turned out to be sufficiently similar to that in a clinical population to justify a correlational study done on students as subjects. Only minor differences were found (Tables 2 and 6).
2. Possible differences between the Pennsylvania and Stanford samples, associated with sampling and testing procedures, were anticipated, for reasons stated in the introductory discussion of procedures. These differences turned out to be unimportant. None of the mean scores for IND, SHSS:A, and SHSS:C turned out to differ significantly between the two samples (Table 3). Also, none of the correlations between the IND and the SHSS scores differed significantly between the two student groups (Table 4).
3. The Eye-Roll sign (ER) alone did not correlate significantly with any of the SHSS scales, the obtained positive correlations ranging between .10 and .18 in the various subsamples (Table 1). These results agree with the ER hypothesis and the findings of others.
4. The induction score (IND), computed independently of the ER, correlated a significant .34 with the combined total SHSS scores (Table 4). When IND scores were dichotomized into lower and higher scores some of the low scorers were among the high scorers on the SHSS, but none of the low scorers were among the highest scorers on the SHSS. The higher scores on the IND scattered widely over the total range of SHSS scores (Table 5).
5. The Profile scores were categorized as intact and nonintact. They were found to correspond closely to dichotomized IND scores (Table 7). In the context of measured hypnotic responsiveness, intactness refers to higher responsiveness, and nonintactness to lower hypnotic responsiveness. The intact-nonintact profiles corresponded in a significant manner to SHSS scores, comparable to the correspondence between dichotomized IND scores (Tables 8 and 9).
These are the empirical findings. There are enough significant relationships to indicate that hypnotic responsiveness as defined by the two scales have empirical common bases. Thus, in this project the 5 to 10
100 ORNE ET AL.
minute HIP, as summarized by the Induction and Profile scoring methods, was found to be moderately related to the two hour SHSS: (A + C)/2 testing procedure. The differences that were found between these two tests set problems for explanation and further investigation.
REFERENCES
ELISEO, T. S. The Hypnotic Induction Profile and hypnotic susceptibility. Int. J. clin. exp. Hypnosis, 1974, 22, 320-326.
HILGARD, E. R. The domain of hypnosis: With some comments on alternative paradigms. Amer. Psychologist, 1973, 28, 972, 982.
ORNE, M. T., & O'CONNELL, D. N. Diagnostic ratings of hypnotizability. Int. J.clin. exp. Hypnosis, 1967, 15, 125-133.
SHOR, R. E., & ORNE, E. C. Harvard Group Scale of Hypnotic Susceptibility, Form A. Palo Alto, Calif.: Consulting Psychologists Press, 1962.
SHOR, R. E., ORNE, M. T., & O'CONNELL, D. N. Psychological correlates of plateau hypnotizability in a special volunteer sample. J. Pers. soc. Psychol., 1966,3, 80-95.
SNEDECOR, G. W., & COCHRAN, W. G. Statistical methods. (6th ed.) Ames, Iowa: Iowa State Univer. Press, 1967.
SPIEGEL, H. An eye-roll test for hypnotizability. Amer. J. clin. Hypnosis, 1972,15, 25-28.
SPIEGEL, H. Manual for Hypnotic Induction Profile: Eye-roll levitation method. (Rev. ed.) New York: Soni Medica, 1974. (a)
SPIEGEL, H. The grade 5 syndrome: The highly hypnotizable person. Int. J. clin. exp. Hypnosis, 1974, 22, 303-319. (b)
SPIEGEL, H. The Hypnotic Induction Profile (HIP): A review of its development. Ann. N. Y. Acad. Sci., 1977, 296, 129-142.
SPIEGEL, H., ARONSON, M., FLEISS, J. L., & HABER, J. Psychometric analysis of the Hypnotic Induction Profile. Int. J. clin. exp. Hypnosis, 1976, 24, 300-315.
SPIEGEL, H., & BRIDGER, A. A. Manual for Hypnotic Induction Profile: Eye-roll levitation method. New York: Soni Medica, 1970.
SPIEGEL, H., FLEISS, J. L., BRIDGER, A. A., & ARONSON, M. Hypnotizability and mental health. In S. Arieti & G. Chrzanowski (Eds.), New dimensions in psychiatry: A world view. New York: Wiley & Sons, 1975. Pp. 341-356.
SPIEGEL, H., & SPIEGEL, D. Manual for Hypnotic Induction Profile. (Rev. ed.) New York: Basic Books, 1978. (a)
SPIEGEL, H., & SPIEGEL, D. Trance and treatment: clinical uses of hypnosis. New York: Basic Books, 1978. (b)
STERN, D. B., SPIEGEL, H., & NEE, J. C. M. The Hypnotic Induction Profile: Normative observations, reliability and validity. Amer. J. clin. Hypnosis, 1978/1979, 21, 109-133.
SWITRAS, J. E. A comparison of the Eye-Roll Test for Hypnotizability and the Stanford Hypnotic Susceptibility Scale, Form A. Amer. J. clin. Hypnosis, 1974, 17, 54-55.
WEITZENHOFFER, A. M., & HILGARD, E. R. Stanford Hypnotic Susceptibility Scale, Forms A and B. Palo Alto, Calif.: Consulting Psychologists Press, 1959.
WEITZENHOFFER, A. M., & HILGARD, E. R. Stanford Hypnotic Susceptibility Scale, Form C. Palo Alto, Calif.: Consulting Psychologists Press, 1962.
WEITZENHOFFER, A. M., & HILGARD, E. R. Revised Stanford Profile Scales of Hypnotic Susceptibility, Forms I and II. Palo Alto, Calif.: Consulting Psychologists Press, 1967.
101 THE HIP AND SHSS:A AND SHSS:C
WHEELER, L., REIS, H. T., WOLFF, E., GRUPSMITH, E., & MORDKOFF, A. M. Eye-roll and hypnotic susceptibility. Int. J. clin. exp. Hypnosis, 1974, 22, 327-334.
Abstrakt: Messungen, die an dem von Spiegel (1974a) klinisch entwickelten Hypnose-Induktions-Profil (HIP) vorgenommen waren, wurden mit denen del im Laboratorium entwickelten Stanford-Hypnoseempfindlichkeitsskalen, Formen A und C (SHSS:A, SHSS:C) von Weitzenhoffer und Hilgard (1959, 1962), und einigen Resultaten des verwandten Harvard-Gruppenmaszstabs fur Hypnoseempfindlichkeit, Form A (Shor & E. Orne, 1962), in Beziehung gebracht. Die Subjekte stellten bezahlte Volontare aus der Studentenbevolkerung der Universitat von Pennsylvania (N = 87) und der Stanford-Universitat (N = 58) dar. Es werden bier einige Unterschiede im Verfahren des Probens und der Testanordnung diskutiert, doch traten nur minimale Unterschiede zwischen den 2 Mustern auf. Positive, jedoch unbedeutende, Korrelationen wurden zwischen dem Augenrollensignal allein und dem SHSS bei den 2 Mustern gefunden. Die Methoden des Resultatsgewinns fur die Induktion (IND) sowie das Profil des HIP wurden mit dem SHSS verglichen. Die IND, eine statistische Skala, entsprach in positiver Weise del des SHSS. Ein reprasentativer Wert ist die bedeutende Korrelation von .34 zwischen den IND- und SHSS:(A + C)/2-Resultaten, wenn man die 2 Muster vereinigte. Bei Anwendung einer angeeigneten chi-Quadratanalyse korrespondieren die zweigeteilten Resultate der Konfigurationspunkte des nominalen Profils (intakt versus beschadigt) bedeutlich mit den zweigeteilten IND-Resultaten wie auch den zweigeteilten SHSS-Resultaten. Die Befunde deuten an, dass das HIP eine massige Beziehung zu dem SHSS aufwies, selbst wenn es ausserhalb seines gewohnlichen, klinischen Rahmens gebraucht wurde.
Resume: Les resultats de l'Hypnotic Induction Profile (HIP) de Spiegel (1974a), obtenus en situation clinique, sont correles avec ceux du Stanford Hypnotic Susceptibility Scales, Forms A & C (SHSS:A, SHSS:C) de Weitzenhoffer et Hilgard (1959, 1962), obtenus en laboratoire, et aussi avec quelques scores du Harvard Group Scale of Hypnotic Susceptibility, Form A (Shor et E. Orne, 1962), fournis par des volontaires payes issus des populations etudiantes de l'Universite de la Pennsylvanie (N = 87) et de l'Universite de Stanford (N = 58). Les auteurs discutent les differences existant entre les procedures d'echantillon- nage et entre l'ordre de passation des echelles, mais ne trouvent que des differences minimes entre les deux echantillons. Des correlations positives mais non significatives sont observees entre l'indice du "roulement d'yeux" et le SHSS, dans les deux echantillons. Les deux types de scores du HIP, soit les scores d'induction (IND) et les scores globaux, sont compares avec ceux du SHSS. Une correlation positive apparait entre le IND, qui con-
102 ORNE ET AL.
stitue une echelle actuarielle, et le SHSS. Le coefficient de correlation de .34 obtenu entre les scores du IND et ceux du SHSS ((A + C)/2), lorsque les scores des deux echantillons sont mis en commun, est representatif de cette correlation significative. Le Chi-carre montre que la dichotomie des scores issus des configurations de profil du HIP (soit intact, soit non- intact) correspond de maniere significative a la dichotomie des scores du IND, et a la dichotomie des scores du SHSS. Les resultats indiquent qu'il existe un rapport modere entre le SHSS et le HIP, meme lorsque le HIP est utilise hors de son habituel contexte clinique.
La relacion entre el Hypnotic Induction Profile y el Stanford Hypnotic Susceptibility Scales, Forms A & C
Martin T. Orne, Ernest R. Hilgard, Herbert Spiegel, David Spiegel, Helen Joan Crawford, Frederick J. Evans, Emily Carota Orne y Edward J. Frischholz
Resumen: Se hace una correlacion entre los resultados del Hypnotic Induction Profile (HIP) de Spiegel y Bridger (1970), obtenidos en clinica, y el Stanford Hypnotic Susceptibility Scales, Forms A & C (SHSS:A, SHSS:C) de Weitzenhoffer y Hilgard (1959, 1962), obtenidos en laboratorio, y tambien con algunos punteados del Harvard Group Scale of Hypnotic Susceptibility, Form A (Shor y E. Orne, 1962) obtenidos de algunos voluntarios, estudiantes de la universidad de la Pennsylvania (N = 87) y la de Stanford (N = 58). Los autores discuten las diferencias que existen entre los procedimientos de seleccion y del orden de administracion de las escalas, y encuentran diferencias minimas. Se observan correlaciones positivas pero no significativas entre el indice del "mover los ojos hacia arriba" y el SHSS, en las dos selecciones. Las dos clases de punteados del HIP, sea el punteado de induccion (IND) sea lo global, se comparan con las del SHSS. Hay una correlacion positiva entre el IND, que constituye una escala actual, y el SHSS. Esta correlacion significativa se encuentra en el coeficiente de correlacion de .34, obtenido entre los punteados del IND y los del SHSS ((A + C)2). El Chi-cuadro muestra que la dicotomia de los punteados de configuracion del profil del HIP (sea intacto, sea non intacto) corresponden significativamente a la dicotomia de los punteados del IND, y a la de los punteados del SHSS. Los resultados indican que hay una relacion moderata entre el SHSS y el HIP, aun cuando el HIP se aplica fuera de su contexto clinico.