Thackray, R. I., & Orne, M. T. A comparison of physiological indices in detection of deception. Psychophysiology, 1968, 4, 219-339.
Institute of the Pennsylvania Hospital and the University of Pennsylvania
ABSTRACT
Physiological measures -- breathing amplitude (BA), breathing cycle time (BCT), galvanic skin response (GSR), skin potential response (SPR), systolic blood pressure (BP), oxygen saturation level (O2S), finger volume (FV), and pulse volume (PV) -- were compared with respect to their relative efficiency in discriminating deception in a lie detection experiment. Thirty Ss were tested. Stimuli consisted of personal words and neutral words made relevant in the context of a mock crime paradigm. Only GSR, SPR, and FV consistently discriminated better than chance, with GSR and SPR significantly superior to FV. BA and O2S yielded some evidence of discrimination, but were inconsistent across stimulus material.
DESCRIPTORS: Blood pressure, Detection of deception, Emotions, Finger volume, Galvanic skin potential, Galvanic skin response, Lie detection, Oxygen saturation, Pulse volume, Respiration, Stress, Verbal behavior.
Relatively little systematic research has been conducted in detection of deception. This is unfortunate since the lie detection paradigm is a very useful one for investigation of physiological response to affective stimuli. In contrast to many of the experimental situations employed in psychophysiological research, the critical stimuli are readily specified and the responses elicited can be evaluated against those occurring to comparable control stimuli. The degree of differential response to the critical and control stimuli provides a convenient measure of the relative responsivity of various psychophysiological variables to affective material.
In detection of deception, there has been continuing controversy among laboratory investigators and field personnel as to the optimal physiological response variable or variables to employ. Of the three measures commonly used in criminal examination (relative blood pressure, respiration, and galvanic skin response), field examiners generally feel blood pressure and respiration to be the most useful indicators of deception and largely discount the value of the galvanic skin re
The authors wish to express their appreciation to William Orchard who served as E1, to Mary Jo Bryan and George Smiltens who were the polygraph technicians, and to Luise Miller who performed the bulk of the statistical computations. We also wish to thank Donald N. O'Connell for his helpful comments during the preparation of the manuscript.
Address requests for reprints to: Martin T. Orne, 111 North Forty-ninth Street, Philadelphia, Pennsylvania, 19139.
329
330 THACKRAY AND ORNE
sponse (Reid and Inbau, 1966). Presumably, it is believed that under the emotionally charged circumstances of criminal interrogation, the galvanic skin response (GSR) is too sensitive and thus fails to respond differentially to the critical and control questions employed. Laboratory investigators, on the other hand, rely on the GSR, and those who have compared it with other variables almost invariably find it to be the superior indicator. Ellson, Davis, Saltzman, and Burke (1952), for example, systematically examined a wide variety of physiological measures in a detection of deception study. Systolic blood pressure and respiration amplitude were found to yield some evidence of discrimination, but both were considerably inferior to the GSR.
While the failure of GSR to discriminate reliably in field applications may be due to the relatively crude instrumentation and methodologies employed (Sternbach, Gustafson, and Colier, 1962), it is well to keep in mind that little is known concerning possible qualitative changes in the pattern of autonomic response to increases in the intensity of a given emotional state. Although the high levels of affect associated with criminal examination can probably not be achieved in the laboratory, it is nevertheless possible to manipulate somewhat lower levels of affect or involvement and look for any indications of relative shifts in optimal indices of deception.
The present study was planned as the first of several to investigate possible changes in optimal physiological indices of deception under high and low levels of S motivation (involvement). Previous research has indicated that personal or idiosyncratic material (Lykken, 1960), and stimuli derived from mock crime paradigms (Lykken, 1959; Thackray and Orne, 1967) yield high rates of detection. These two types of stimulus material were employed in this initial study in the hopes of achieving a reasonably high level of S involvement. A variety of physiological measures were studied including breathing amplitude, breathing cycle time, galvanic skin response, skin potential response, systolic blood pressure, blood oxygen saturation level, finger blood volume, and finger pulse volume. With the exception of skin potential response and oxygen saturation level, all of the above measures have been previously employed in detection of deception in some combination with varying degrees of success (Ellson et al. 1952; Kubis, 1962; Kugelmas and Lieblich, 1966; Violante and Ross, 1964).
Two other aspects of the study were included for another purpose and will be reported separately. While these aspects are not directly relevant to the data reported here, they are relevant to the design of the experiment and the procedure employed. One dealt with the question of whether detection of personal material is superior to detection of neutral material made relevant only in the experimental context. The other concerned possible changes in detection efficiency of these two types of stimulus material under a condition in which S is not aware that detection is occurring and hence is not attempting deception.
METHOD
Subjects
Thirty male undergraduate Ss were recruited from local universities and randomly assigned to two groups. None had previously participated in detection of deception experiments.
331 INDICES IN DETECTING DECEPTION
Procedure
Each S was first seen by El who explained that we were studying the effectiveness of the polygraph as a lie detector. It was explained to him that he was to play the role of an espionage agent who knows certain critical code words and that he would later be given a polygraph examination by the interrogator (E2). He was told that, because of a security leak, the interrogator was in possession of a pool of code words as well as the names and dates of birth of six agents. The S's own name, date of birth, and code words to be learned would be included in this list. In order to maintain his anonymity, however, he would be introduced to E2 as "S 27," and the interrogator would not know whether he (the S) was one of the individuals whose names he had or whether he was, in fact, innocent (belonged to a control group who did not receive special information). The S's task was to convince the interrogator that he was innocent and that none of the code words or personal information had any meaning to him. It was explained that, while it was difficult to deceive the polygraph, some highly intelligent and mature individuals had been able to do so. The S was then given a booklet which was constructed to maximize overlearning of three code words.
When the S had finished learning the code words, he was led to the polygraph room by El and introduced to E2 (the interrogator) as S 27. At the same time El also gave E2 the stimulus material to be used in the examination. While no innocent Ss were used in this study, E2 was blind as to the relevant code words and to the items of personal information which pertained to the S. Then E2 asked the S to be seated in a Stratolounger chair and told him that the purpose of the experiment was to determine his guilt or innocence. He treated the S the way an interrogator might and emphasized the virtual infallibility of the polygraph. The S was told that he might as well save a good deal of time and effort by confessing (no S did). Various electrodes and other devices were then attached to S. It was explained that the procedure to be followed was modeled closely after that of a "real-life" polygraph examination, i.e., the questions to be asked would first be reviewed with S to eliminate any surprise, ambiguity, or uncertainty which might interfere with interpretation of the later polygraph examination. During this review phase, GSRs were telemetered to an adjoining room under conditions which minimized the S's awareness that his responses were being monitored. (This aspect of the experiment is not relevant to the present data and, as noted earlier, will be discussed in a separate paper.)
The questions consisted of six sets of six words each, with the first word in each set being a dummy foil. Three sets (the code word material) contained the names of common birds, trees, and colors respectively; of the remaining sets, one contained first names, one last names, and one dates of birth. The sets were constructed by an assistant prior to the experiment, and the items of personal information pertaining to a given S as well as the code words to be learned were randomly inserted in their appropriate sets. The six sets of stimulus cards were presented to E, before S's arrival and he was informed as to S's identity and the code words to be learned.
During the polygraph examination, the six sets of stimulus items were presented once to the S, and he was instructed to respond to each item with either a
332 THACKRAY AND ORNE
"yes" or "no." Half the Ss received the code word material first followed by the personal material, while the order was reversed for the remaining half. Sixteen seconds elapsed between each stimulus to allow sufficient time for the different latencies of the various measures being recorded.
Apparatus
Physiological responses were recorded on an 8-channel Offner Type R Dynograph. The Dynograph and all associated equipment were located behind S in the examination room.
Respiration. The transducer for measuring respiration consisted of a thin mercury-in-vinyl tube (Parks Electronics Laboratory). The ends of the tube were attached to Velcro bands and positioned on the S at the base of the rib cage. The mercury belt formed one of the arms of a bridge circuit.
Galvanic skin response. A Beckman Type 9892A bridge modified for use with battery supply was used for measuring skin resistance. Beckman silver-silver chloride biopotential electrodes were employed with Redux electrode paste. Electrodes were placed on the palmar surface of the right hand; one was located on the thenar and the other on the hypothenar eminence. Current density was 3.8 microamperes/cm2. Both AC and DC recordings were obtained. A 0.3 second time constant was used for the AC channel.
Skin potential response. One Beckman biopotential electrode (active) was placed on the left hand at the center of the palm while the other electrode (reference) was placed on the dorsal surface of the arm approximately ten cm above the ulnar protuberance. Electrodes were kept shunted when not in use, and no electrode pair having a bias potential greater than 0.5 mv at the time of recording was used. Recording was DC with a gain of 2 mv/cm.
Finger and pulse volume. A photoelectric finger plethysmograph was employed for measuring relative changes in blood volume. The device incorporated fiber optics for transmitting light to and from the finger to minimize temperature effects. The sensing unit was attached to the second finger of the right hand. A Gulton pulse sensor was attached to the third finger for registering pulse volume changes.
Blood pressure. Intermittent measures of systolic blood pressure were obtained with a Beckman Fels Model Systolic Monitor. This unit employs a finger cuff and sensor which were attached to the first finger of the right hand. The device was adjusted to yield a measure of systolic pressure approximately every fourth heart beat.
Oxygen saturation. A Waters Model XP-350 Oximeter measured changes in blood oxygen saturation level. The photoelectric sensors, attached to the left ear lobe, respond differentially to the red and infra-red portions of the spectrum, thus giving a measure of oxygen saturation virtually independent of changes in blood volume. The light source in the ear transducer was turned on for a period of at least 15 minutes before calibration and recording to minimize instability and drift.
Measures
The response occurring to each of the critical stimuli was ranked against the four control words in its respective set. This was done separately for each variable.
333 INDICES TN DETECTING DECEPTION
Mean ranks were then determined for each S on each variable. It was decided to treat responses on all variables in terms of ranks, since some could not be measured in absolute units, but had to be measured in terms of per cent change or arbitrary units.
The measurement of each variable was as follows:
Breathing amplitude (BA) and breathing cycle time (BCT). The first two breathing cycles to occur in the interval extending two seconds after a stimulus to the onset of the subsequent stimulus was noted and the amplitude of the smaller inspiration measured. A rank of one was assigned to the stimulus in a given set showing the smallest poststimulus amplitude. A measure of breathing cycle time was obtained by determining the distance between the points of maximum inspiration in the two cycles. The longest breathing cycle time in a stimulus set received a rank of one.
Galvanic skin response (GSR). Magnitude of GSR was obtained by measuring the difference in skin resistance between the level at the time of stimulus occurrence and the lowest level reached within five seconds. A rank of one was assigned to the largest GSR in each set.
Skin potential response (SPR). The same measurement interval used for GSR was also used for SPR. Because diphasic responses were anticipated, it was decided to sum the "a" and "b" components as an index of the total response to a stimulus. In actuality, however, diphasic responses were observed in only about 20 per cent of the Ss. Consequently, while both components were summed when they occurred, for most Ss it was the magnitude of the "a" wave which constituted the measured response. As with GSR, the largest response received a rank of one.
Finger volume (F V) and pulse volume (PV). For finger volume the ten-second period following stimulus onset was used as the measurement interval. The difference was obtained between the highest point immediately following the stimulus and the lowest point (maximum vasoconstriction) in the interval. The largest difference was assigned a rank of one. The same measurement period was also used for pulse volume. In this instance, however, the smallest pulse wave in the poststimulus interval was expressed as a percentage of the highest pulse immediately following the stimulus. The smallest percentage (indicating maximum change) in a set was ranked one.
Blood pressure (BP). Magnitude of blood pressure change was derived by measuring the difference between the level at stimulus onset and the highest pressure attained within a ten-second poststimulus interval. A rank of one was assigned to the largest difference.
Oxygen saturation level (O2S) highest level in the first segment was compared with the lowest level in the second and the difference obtained. The stimulus showing greatest decrease in oxygen saturation was ranked one.
RESULTS
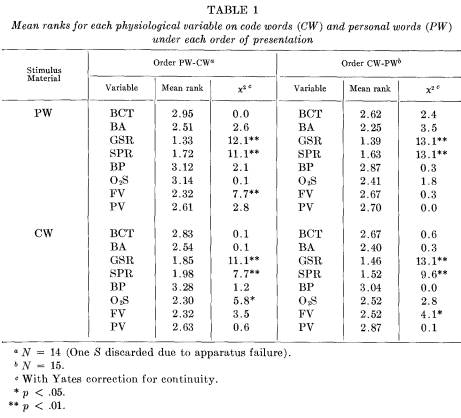
Table 1 displays the mean ranks obtained on the physiological variables under each order of stimulus presentation. For these data a mean of 3.00 indicates
334 THACKRAY AND ORNE
chance detection, while a mean of 1.00 would signify perfect detection. Also given in Table 1 are the results of chi-square tests for significance of detection. These tests were conducted by determining the number of mean ranks above and below the expected chance value of 3.00 for each distribution and then comparing the obtained with the expected frequencies. It is evident that the only variables consistently demonstrating significant detection (p < .05) are galvanic skin response and skin potential response. Of the other variables, finger volume yields significant detection in two of the distributions and oxygen saturation in one. With the exception of blood pressure, however, all of the remaining variables generally display mean values of less than 3.00. This suggests that, if orders of presentation could be combined, some of the less powerful variables might yield significant discrimination.
To test for order effects, it was decided that only those variables yielding consistently significant discrimination (GSR and SPR) could be meaningfully compared. Thus, comparisons were made between GSR ranks of personal words under both orders of presentation, and between GSR ranks of code words under both orders. The same comparisons were made for the SPR data. None of the comparisons were significant at the .05 level (Mann-Whitney U, two-tailed). The orders were then combined for all variables and the results shown in Table 2. The
335 INDICES IN DETECTING DECEPTION
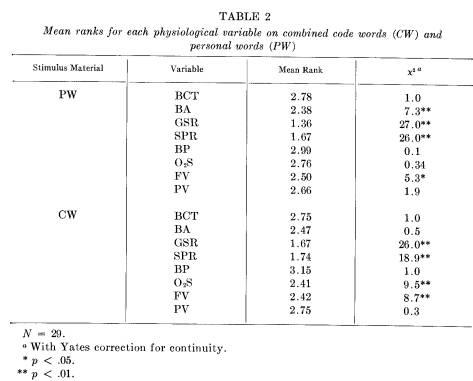
combined data again reveal GSR and SPR to be the most sensitive discriminators, with significant discrimination also shown for finger volume under both types of stimulus material. In addition, there is some evidence that breathing amplitude as well as oxygen saturation level discriminates significantly, although the data are not consistent across stimulus material.
Further combining of data across stimulus material was not considered justifiable. Comparisons between personal and code word material on each of the three measures (galvanic skin response, skin potential response, and finger volume) showing better than chance discrimination under both types of material revealed a significant difference only for GSR (Wilcoxon test, T = 47.5, p < .05, onetailed). Nevertheless, since the GSR-telemetered data, also obtained during this phase, yielded a significant difference in favor of personal words there is sufficient indication of a real difference between stimulus material to make combining of any of the variables across stimulus conditions unwarranted.1
Tables 3 and 4 reveal the results of Wilcoxon tests conducted on the variables showing significant discrimination on the personal word and code word data respectively. Although tabled T values could be obtained for some of the comparisons, all were converted to z values for uniformity. All comparisons in Table
336 THACKRAY AND ORNE
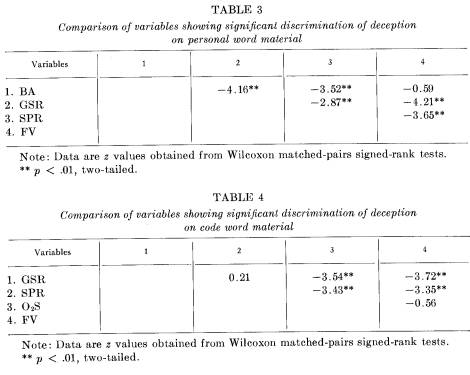
3 are significant except for the comparison of finger volume with breathing amplitude. In Table 4 galvanic skin response does not differ from skin potential response, and no difference exists between oxygen saturation and finger volume. The remaining comparisons are all significant.
DISCUSSION
The results of the present study show three variables (galvanic skin response, skin potential response, and finger volume) to be effective in significantly discriminating deception with both of the types of stimulus material employed, although finger volume is significantly less effective than either of the other two. Of the remaining variables, breathing amplitude and oxygen saturation level reveal evidence of significant but inconsistent discrimination. It is worth noting, however, that the means of all variables displayed in Table 2, with the possible exception of blood pressure, are less than the expected chance value of 3.00. This might suggest that, with this one exception, all are discriminating deception to some limited extent. Under such conditions, chance factors could easily result in certain variables achieving significant but inconsistent discrimination, and this is probably the explanation for the finding that oxygen saturation and breathing amplitude are not equally effective in their discrimination under the two types of stimulus material.
Few previous studies have been concerned with the question of the relative efficiency of a variety of physiological measures in detection of deception. A
337 INDICES IN DETECTING DECEPTION
notable exception is the investigation referred to previously by Ellson et al. (1952) in which galvanic skin response, breathing amplitude and rate, systolic and diastolic blood pressure, pressure pulse, pulse rate, and pulse volume were compared within a single study. As noted earlier, their general findings were that galvanic skin response was by far the best single index of deception. Systolic blood pressure and breathing amplitude revealed significant but inconsistent discrimination. Both were effective indices, but only in one of the two similar experiments reported. Breathing cycle time, pressure pulse, pulse rate, and pulse volume were quite ineffective, with diastolic blood pressure showing no evidence of discrimination.
In general, the results reported by Ellson et al. are in agreement with the results obtained from comparable variables employed in the present study, except with regard to systolic blood pressure. Careful examination of the obtained blood pressure recordings revealed no evidence for artifacts or malfunctions which could materially contribute to error. It is possible, of course, that even the relatively frequent measures of blood pressure obtained in the present study inadequately reflected the significant changes. Field polygraph operators, for example, obtain a continuous measure of relative blood pressure from an arm cuff inflated to a point halfway between systolic and diastolic pressure. Intermittent measurement, however, would not appear to be the sole explanation for the failure of blood pressure in the present study. Ellson et al. reported successful discrimination with an automatic system which yielded measures at considerably longer intervals (20 seconds) than were used here. In contrast, Landis and Wiley (1926) employed a continuous measure of relative blood pressure and failed to find any evidence for significant discrimination of deception. While methodological problems of measurement may have contributed to the failure of blood pressure in the present study, an alternate possibility is that the critical stimuli employed failed to evoke levels of emotional arousal sufficiently high to significantly affect the arterial system. This would appear to be a possible explanation, although it must remain conjecture since no single measure presently exists for assessing the absolute levels of stress or arousal involved in this experiment.
Of the remaining laboratory studies in deception which have compared GSR with other variables, there is general agreement that it is the superior measure (Kubis, 1962; Violante and Ross, 1964). Kubis also found pulse volume to be slightly superior to respiration, although neither appeared to discriminate well. In contrast, Violante and Ross found respiration measures more efficient than pulse volume, but both were quite inferior to GSR. These latter investigators also employed a finger volume measure and found it to be a less effective discriminator than pulse volume, except for the 20 per cent of their sample who were highly responsive in pulse volume. It is interesting that differences between finger volume and pulse volume in relative discrimination were found not only in the present study, but in a previous one as well. Finger and pulse volume are logically related phenomena and should be highly correlated, although Davis, Buchwald, and Frankmann (1965) report substantial differences between these measures in latency, variability, and rate of adaptation to auditory stimuli. More research is needed in which quantitative measures of finger and pulse volume are
338 THACKRAY AND ORNE
examined with respect to their degree of covariation in order to determine whether these variables reflect the same or somewhat different physiological functions.
The comparison of GSR and SPR revealed both to be highly effective in discriminating deception. GSR, however, consistently displayed lower mean values (discriminated better) than SPR with both types of stimulus material, and with personal material GSR was significantly superior to SPR. In a recent study, Burstein, Fenz, Bergeron, and Epstein (1965) compared GSR and SPR to words of varying emotional value. Their general findings were that GSR and total SPR (summation of all component waveforms) yielded virtually identical response gradients to increasing levels of stimulus intensity. Intersubject correlations between GSR and total SPR, however, ranged from 0.04 for neutral words to 0.52 for words with high affect value. In addition, the average intrasubject correlation for these same measures was only 0.66. In the present study, an index of relative agreement in discriminating deception was obtained by correlating the mean ranks for GSR and SPR. For both personal material and code words the correlations were identical (r s = 0.58, p < .01).
Comparing the results of the present study with those reported by Burstein et al., it would appear that both GSR and total SPR respond in a similar manner to affective stimuli, but the fairly low correlations suggest sizable individual differences. The fact that GSR seems somewhat superior to SPR in the present study must be viewed with caution, however. Although approximately 80 per cent of our Ss displayed only a monophasic, negative response to virtually all stimuli, the remaining Ss showed diphasic responses, especially to the significant stimuli. These differences in waveform make the problems of quantification and interpretation more difficult with SPR than with GSR. In addition, it should be pointed out that both AC and DC recordings were used with GSR, while only DC recording was employed with SPR. Most of the measurements of the GSR data were made on the DC channel, but during occasional periods of low resistance change to the stimuli, measurements were obtained from the higher gain AC channel. Since low resistance changes were generally accompanied by low skin potential changes, the measurement error may have been greater for SPR during these periods. Although these instances were few, they could have contributed to the apparent superiority of GSR.
Blood oxygen saturation level has been shown to reflect emotional changes (Lovett-Doust and Schneider, 1955), and it has been suggested as a promising measure in detection of deception (Dana and Barnett, 1957). In the present study, the mean decrease in oxygen saturation to the relevant personal words was found to be 0.37 per cent O2S, while for the nonrelevant comparison stimuli it was 0.34. For the code word material, changes of 0.34 and 0.44 per cent O2S were obtained to the noncritical and critical stimuli respectively. The absolute magnitude of these changes is small, and the variable discriminated significantly on only one of the two types of stimulus material. This suggests that oxygen saturation level is of limited value as a laboratory measure for discriminating deception, although its effectiveness in contexts of extreme emotional arousal remains to be evaluated.
In view of the consistent reports from field polygraph operators that, under
339 INDICES IN DETECTING DECEPTION
conditions of interrogation, respiration and blood pressure are more effective and reliable in detecting deception than the GSR, it was hoped that a laboratory situation might be created with sufficiently intense subjective involvement to yield significant discrimination with these two variables. The results, however, yielded no evidence of discrimination with systolic blood pressure and only poor discrimination with breathing amplitude. The finding that the electrodermal response was the single best index of deception is in line with previous laboratory findings where multiple indices have been employed. It is probable that the experimental situation devised still failed to elicit the intense emotional arousal characteristic of real life interrogation and therefore great caution is indicated in generalizing from these results. Data from situations where the intensity of the S's involvement is known to be great are needed.
REFERENCES
Burstein, K. R., Fenz, W. D., Bergeron, J., & Epstein, S. A comparison of skin potential and skin resistance response as measures of emotional responsivity. Psychophysiology, 1965, 2: 14-24.
Dana, H. J., & Barnett, C. C. The emotional stress meter. In V. A. Leonard (Ed.), Academy lectures on lie detection. Springfield, Ill.: Thomas, 1957. Pp. 73-83.
Davis, R. C., Buchwald, A. M., & Frankmann, R. W. Autonomic and muscular responses and their relation to simple stimuli. Psychological Monogr.: gen. and appl., 1955, 69: 1-71.
Ellson, D. G., Davis, R. C., Saltzman, I. J., & Burke, C. J. A report of research on detection of deception. (Contract N6onr-18011 with Office of Naval Research.) Distrubuted by Department of Psychology, Indiana University, Bloomington, Indiana, 1952.
Kubis, J. F. Studies in lie detection: Computer feasibility considerations. Contract AF30(602)-2270, Project 5534. Prepared for Rome Air Development Center, TR 62025. (Distributed by Arlington, Va.: ASTIA, AD-284902) June, 1962.
Kugelmas, S., & Lieblich, I. The effects of realistic stress and procedural interference in experimental lie detection. J. of appl. Psychol., 1966, 50: 211-216.
Landis, C., & Wiley, L. E. Changes of blood pressure and respiration during deception. J. of comp. Psychol., 1926, 6: 1-19.
Lovett-Doust, J. W., & Schneider, R. A. Studies on the physiology of awareness: An oximetrically monitored controlled stress test. Canadian J. Psychol., 1955, 9: 67-78.
Lykken, D. T. The GSR in the detection of guilt. J. of appl. Psychol., 1959, 43: 385-388.
Lykken, D. T. The validity of the guilty knowledge technique: The effects of faking. J.of appl. Psychol., 1960, 44: 258-262.
Reid, J. E., & Inbau, F. E. Truth and deception. Baltimore: Williams & Wilkins, 1966.
Sternbach, R. A., Gustafson, L. A., & Colier, R. L. Don't trust the lie detector. Harvard Business Review, 1962, 40: 127-134.
Thackray, R. I., & Orne, M. T. Methodological studies in detection of deception. U. S. Army Medical Research and Development Command Research Report filed with DDC, AD-645102, January, 1967.
Violante, R., & Ross, S. A. Research on interrogation procedures. Contract
Nonr 4129(00), Stanford Research Institute, Menlo Park, California, 15 May-31
October, 1964.