|
Vibrational Spectroscopy
|
|
|
At the
core of Raman Spectroscopy theory is the idea that molecules can
vibrate. The vibrational modes of a molecule can best be modeled
by assuming that the compound is composed of atoms (balls) joined by chemical
bonds composed of springs (rather than the traditional sticks). When
viewed in this way, it becomes apparent that an input of energy into the
molecule will cause the molecule to vibrate. (3 and 4)
Vibrational modes for the molecule are a function of
the orientation of its atoms and bonds, the atomic mass of the atoms, bond
order and hydrogen bonding, among other factors. The vibrational modes
for carbon dioxide an water are illustrated in the diagram to the right.Click
on this link to view an animation of the vibrational modes of Water.
Click
on this link to view an animation of the vibrational modes of Carbon Dioxide.
Each Vibrational mode is initiated by a
specific frequency, usually in the infrared region of the electromagnetic spectrum.
These modes are quantized much like atomic energy levels. The lowest
vibrational energy level for a molecule is denoted as vo which is
also called zero point energy. The first excited state is indicated by
v1, then v2, etc. (3and 4)
|
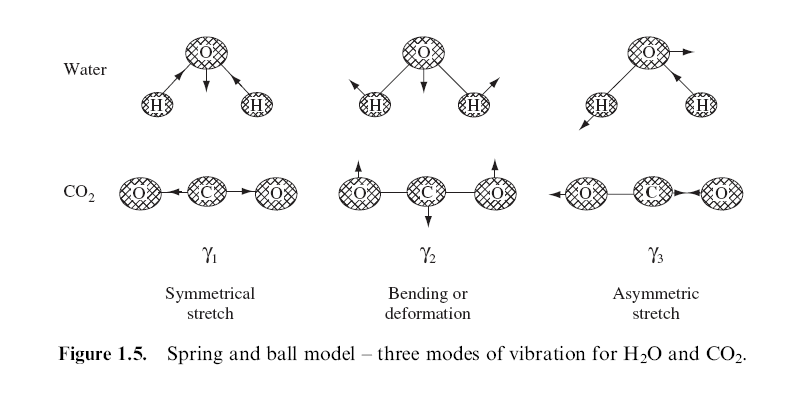
Figure 1 from: Smith, Ewin, Modern Raman Spectroscopy- A Practical Approach,
Wiley, 2005, p. 8.
|
|
What is Raman Spectroscopy?
|
|
|
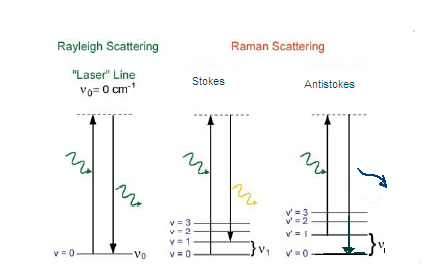
Figure 2 adapted from http://www.inphotonics.com/technote11.pdf
|
In
this type of spectroscopy, the species of interest (including molecules or
polyatomic ions) is irradiated by photons of known energy. In Stokes
scatter (ceneter diagram ), the energy from the photon is absorbed and the
target molecule is promoted to a higher (virtual) energy state. Some of
the energy from the incident photon is used by the molecule to excite it to
higher level vibrational and rotational states, the rest is emitted as a
photon of reduced energy. This photon is commonly called the Raman
photon. Stokes scatter results when the molecule is excited from ground state
(v0) and results in a molecule at a
higher energy state (v1). The
energy of this photon is equal to the difference between the incident light
and the energy absorbed by the molecule. The Raman photon energy is
equivalent to a transition from v0 to v1 vibrational state for the molecule
being studied.
Anti-Stokes scatter (diagram on right) results when
a molecule in an excited state (v1) is
gains energy from the incident photon. It then decays back to a
lower energy level, ground state (v0),
with the emission of a higher energy photon than the incident
radiation. Since very few molecules reside in the excited state,
Anti-Stokes scatter does not predominate in a Raman Spectra. In both
Stokes and Anti-Stokes scatter, the difference between the incident photon
and the emitted photon is equal to the transition energy (v0 to v1)
for the molecule. Rayleigh scatter simply releases a photon of equal
energy. (5)
|
|
How does Raman Spectroscopy
Work?
|
|
|
|
Raman
spectroscopy occurs as a result of a molecular vibration causing a
"change in polarizability" of the molecule. In contrast, for
a molecule to be infrared active, the vibration must cause a change in the
permanent dipole moment. A simple case of a Raman Active molecule would
be a species such as CS2. The symmetrical stretch out and
then in (pictured to the right) will be detected by Raman spectroscopy.
Since the molecule has no permanent dipole, this stretch would be invisible
in an infrared spectra.
If a molecule has a center of symmetry, Raman active
vibrations would not be visible in the infrared. For example, the
symmetric stretch of CS2 is Raman active. The asymmetric
stretches, which induce a dipole, are infrared active. As a result of
this fundamental difference, it is often said that Raman and Infrared Spectra
are complementary, meaning that, between the two, the analyst should be able
to get a fairly complete picture of the vibrational modes of a
molecule. (5,6)
|
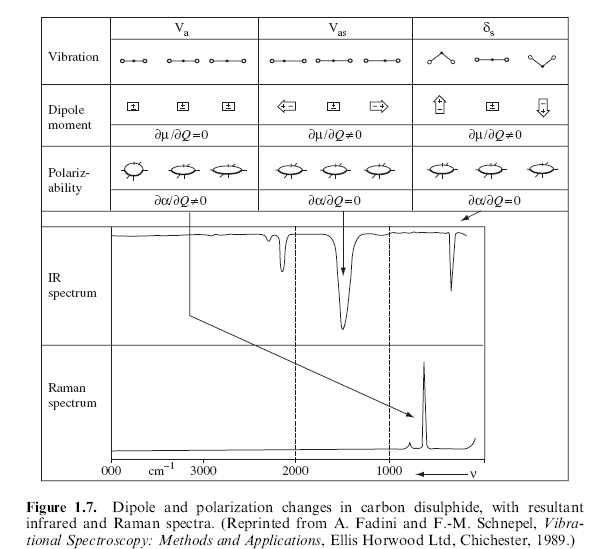
Figure 3 from: Smith, Ewin, Modern Raman Spectroscopy- A Practical Approach,
Wiley, 2005, p. 10.
|
|
What kinds of compounds can be detected by Raman
Spectroscopy?
|
|
|
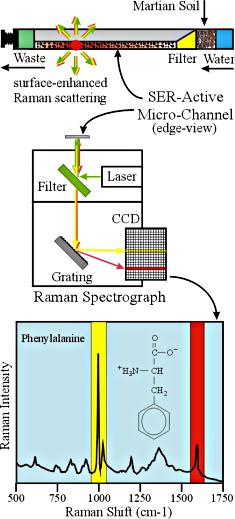
Figure 4: A Raman Sctrophotometer employing SERS Technology, http://epsc.wustl.edu/haskin-group/Raman/instrument.htm
|
One of
the reasons Raman Spectroscopy has been proposed for interplanetary
exploration is that this method of analysis can detect a wide range of
compounds from inorganic to organic. Geologists on earth have
successfully used this technique to identify minerals in rocks and other
geologic formations.
The detection of organic molecules has been more
difficult. Generally, organic molecules have a small photon absorption
cross section. As a result, until recently, only a very weak signal
could be produced when analyzing organic molecules. Additionally, on the
Martian surface, the presence of organic molecules is expected to be in a
very low concentration (if any). An adaptation designed to increase the
amount of photon scattering is called Surface Active Raman Scattering (SERS).
It has been observed that,
when placed on or near a metal surface, compounds or polyatomic ions can
increase the number of Raman photons scattered by a factor of 103 to
106. Although this effect appears to be strongest on a
silver surface, other metals such as gold or copper also demonstrate this
ability to increase the Raman scatter. This process enhances the
electromagnetic field on the metal surface which, in turn, enhances the
vibrational modes of the sample on its surface. Additionally, the SERS
method causes a "charge-transfer complex" to be formed between the
metal and the sample. This then causes resonance enhancement of the
Raman signal to occur. (5)
The SERS method is particularly
suited for electron rich molecules that contain lone electron pairs or pi
electrons. Compounds that respond well to SERS include aromatic amines,
phenols, compounds containing oxygen and carboxylic acids. Use of this
technique would greatly improve the sensitivity of the Raman analysis on the
Martian surface. Even if amino acids are present on or near the
surface, it is hypothesized that their population would be extremely
low. The diagram to the right shows how the SERS design can be
incorporated into a Raman Spectrometer. (5,6,7)
|