Boyle’s
Law:
Verification
Boyle's Equation


Robert Boyle
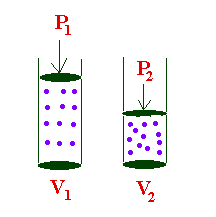
If the temperature of a gas is constant, as the pressure on the gas increases the volume will decrease. The inverse is also true. If the pressure on the gas decreases then the volume will increase. It was Robert Boyle, in 1662, who was first to fully investigated the pressure-volume relationship of gases. Boyle used a tube containing a gas and mercury. When he changed the amount of mercury in the tube he changed the pressure, which in turn changed the amount of space occupied by the gas. When the amount of mercury was doubled, the volume decreased by half.
Robert
Boyle’s observations are summed up in Boyle’s law, which states that
for a
given mass of gas at constant temperature, the volume of a gas varies
inversely
with pressure. Because of the inverse relationship, the product of the
two
quantities, pressure and volume, is constant. When given any two sets
of
pressure and volume, at a given temperature, the product will be the
constant.
When you look at the first set of data plotted on the graph you notice the curve of the line indicating the inverse relationship between pressure and volume. As the pressure was decreasing the volume was increasing. When you take any point on the curve and multiply the pressure value by the volume value the product equals the constant. This graph is consistent with Boyle’s law.
The second graph is showing the relationship between 1/pressure and volume. When the data is plotted in this format the slope of the line is linear. This is also consistent with Boyle’s law. If there is an inverse relationship between two variables, plotting the inverse of one variable will generate a straight line.
Plotting Boyle’s data onto a graph allows us to better see the relationship between pressure and volume and what ultimately led to Boyle’s law.