XRD Basics
What is x-ray diffraction?
X-ray diffraction (XRD) is a non-destructive technique for analyzing the structure of materials, primarily
at the atomic or molecular level. It works best for materials that are crystalline or partially
crystalline (i.e., that have periodic structural order) but is also used to study non-crystalline materials.
XRD relies on the fact that X-rays are a form of light, with wavelengths on the order of
nanometers.
When X-rays scatter from a substance with structure at that length scale,
interference can take place,
resulting in a pattern of higher and lower intensities. This is qualitatively similar to the colorful
patterns produced by soap bubbles, in which different colors are viewed in different directions.
XRD is quite different from
X-ray radiography, or
tomography. Tomography relies on the fact that
the X-rays are absorbed more strongly by some materials than others--for example, bone or tumors
absorb more than muscle or fat. Therefore, the transmitted image provides a direct image of the
structure inside the body or object (typically a length scales of a millimeter or above), making it an invaluable tool for doctors. (X-ray tomography is
also widely used in other fields such as materials science and metallurgy.) In contrast, the
XRD produces a diffraction pattern, which does not superficially resemble the underlying structure, and
provides information about the internal structure on length scales from 0.1 to 100 nm.
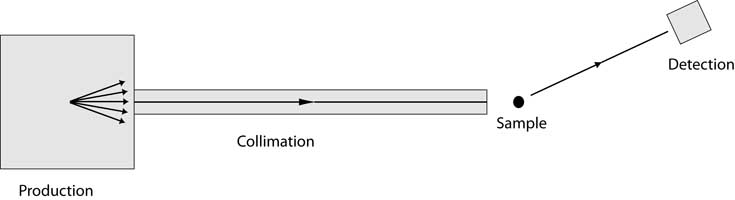
In its most simplified form, a generic X-ray scattering measurement is shown below.
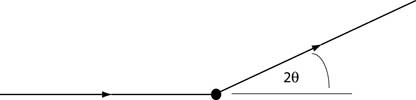 A beam of X-rays is directed towards a sample, and the scattered intensity is measured as a function
of outgoing direction. By convention, the angle between the incoming and outgoing beam directions is called
2θ. For the simplest possible sample, consisting of sheets of charge separated by a distance d,
constructive interference (greater scattered intensity) is observed when
Bragg's Law is satisfied:
n λ = 2 d sin θ
Here n is an integer (1, 2, 3, ...), λ is the wavelength of the x-ray beam, and
θ is half the scattering angle 2 θ shown above.
A beam of X-rays is directed towards a sample, and the scattered intensity is measured as a function
of outgoing direction. By convention, the angle between the incoming and outgoing beam directions is called
2θ. For the simplest possible sample, consisting of sheets of charge separated by a distance d,
constructive interference (greater scattered intensity) is observed when
Bragg's Law is satisfied:
n λ = 2 d sin θ
Here n is an integer (1, 2, 3, ...), λ is the wavelength of the x-ray beam, and
θ is half the scattering angle 2 θ shown above.
Real materials are more complicated, of course, but the general result holds that there is a relationship
between interparticle distances within the sample and the angles at which the scattered intensity is the
highest, with larger distances d corresponding to smaller scattering angles
2θ.
What types of measurement are typically made?
Books have been filled describing different specialized techniques! But here is a short glossary of
the most important techniques.
- Single-crystal crystallography.
|
A high quality single crystal is grown and placed in different orientations in the x-ray beam.
The resulting diffraction patterns can resemble the one shown to the right. The positions of the
spots give information on the crystal lattice symmetry and dimensions, while the intensities can be
analyzed to determine atomic positions within each unit cell. Additionally, the shapes and widths of
individual peaks can sometimes be analyzed to determine details of crystallite sizes, as well as
microscopic strains and defects.
Single-crystal measurements generally yield more information than other XRD techniques, but
they are also the most difficult. Growing high quality single crystals is at best difficult and often
impossible, and many measurements must be made at different sample orientations to
obtain the information necessary for a full crystallographic determination.
An important application of single-crystal diffraction is
Protein
crystallography, a central technique in modern molecular biology.
|
|
- Powder Diffraction.
|
Instead of a single crystal, the sample consists of a mixture of many crystallites, often in the
form of a finely ground powder. Instead of the pattern of sharp spots shown above, the pattern
now consists of concentric rings, each having the same scattering angle 2θ that an individual
spot would have had in a single crystal pattern.
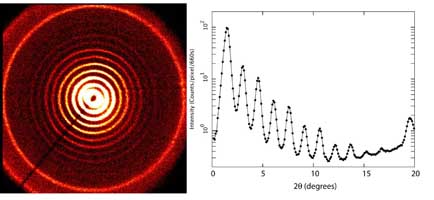
A powder diffraction pattern from silver behenate (a layered organic crystal) is shown to the right.
with a corresponding line plot.
Powder diffraction is most commonly used in two complementary ways:
- As an alternative to single-crystal diffraction. It is much easier to produce a powder sample
than a single crystal. Although valuable information is lost during
the "powder averaging" process that turns sharp spots into rings, crystal structures can
still be solved with this technique as long as they are relatively small and there is not excessive
overlap between the peaks. The method of
Rietveld refinement
is often used to determine the crystal structure that is most likely to have given rise to the observed
pattern. As with single crystal diffraction, the shapes and widths of
individual peaks can sometimes be analyzed to determine details of crystallite sizes, as well as
microscopic strains and defects.
- For phase identification, most often used in mineralogy. Often a mineral or clay sample will
consist of a mixture of different crystal phases. The "fingerprint" of a powder diffraction pattern can then be
compared to a
data base of known patterns to determine which
phase or phases are present.
|
|
- Fiber Diffraction.
|
The fiber diffraction approach is intermediate between the single crystal and powder approaches.
The sample is typically an extruded fiber, with a well-defined crystal axis aligned along
the fiber axis (also known as the "meridian"), and cylindrical averaging about that axis.
A famous example of this technique was the
1953 determination of the structure of DNA.
In that case, growing true single crystals proved to be challenging (and analyzing the data from single crystals
was also an unsolved problem at the time), but the
additional orientation of the diffraction pattern due to the fiber geometry was
enough to deduce the helical form of the DNA molecule.
Fiber diffraction is often used when studying long-chain molecules such as DNA, or columnar
structures such as
discotic liquid crystals.
Due to the curvature of the Ewald sphere, the diffraction pattern observed on a flat detector is distorted, and some portions of the Ewald sphere are actually inaccessible. The Fraser correction (R. D. B. Fraser, T. P. Macrae, A. Miller, R. J. Rowlands, J. Appl. Cryst. 9, 81 (1976))
maps the observed data onto a Cartesian grid.
|
|
- Grazing Incidence Diffraction and X-ray Reflectivity.
|
The closely related techniques of
Grazing Incidence Diffraction
(GID), also called Grazing Incidence X-ray Scattering (GIXS) and
X-ray Reflectivity (XR) utilize the fact that, when the beam of X-rays impinges on a surface at very low
incident angle (αi in the picture to the right), the reflectivity is greatly enhanced and the beam
penetrates only a short distance into the surface. This approach is therefore ideal for measuring the properties
of thin films or multilayers on solid or liquid substrates.
In a typical GID measurement, αi is held fixed and the intensity is measured as a function
of 2θ. The resultant intensity profile can be analyzed to establish the two-dimensional crystal
structure within the plane of the film.
In a typical XR measurement, 2θ is fixed at zero, and the reflected intensity is measured as a
function of αi. The resultant intensity profile can be analyzed to
the thickness of the layer (or, layers in a multilayer film), and in some cases to say something about
the electron density profile within each layer.
|
|
- Small-Angle X-ray Scattering.
|
Small-angle X-ray Scattering
(SAXS), also known as simply Small Angle Scattering (SAS)
refers by definition to experiments where the scattering angle 2θ is small, generally less than
10°. Following
Bragg's Law, this implies that the length scale of the objects being
probed is fairly large, typically in the range between 3 and 100 nm.
Historically, this technique was primarily used to study relatively large "objects" dispersed in a
medium, such proteins dissolved in an aqueous medium, colloidal particles, micelles, or
voids in porous media.
More recently, SAXS has been used to study self-assembled systems such as
block copolymers that have periodic order with repeat distances much larger than a single molecule.
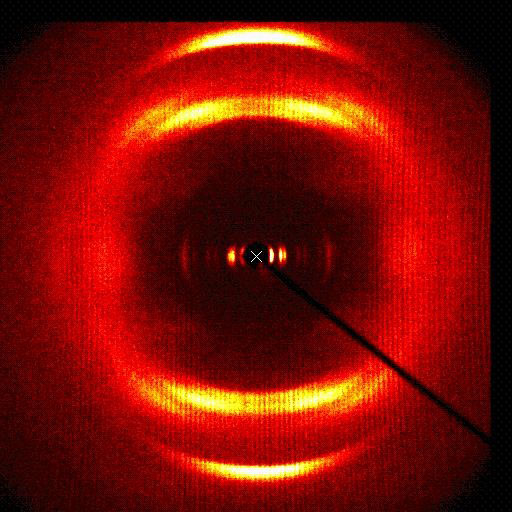
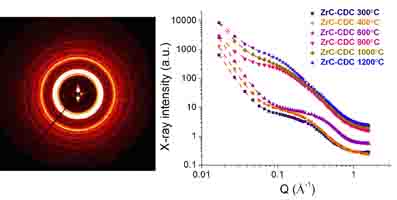
The image to the right shows a small-angle powder diffraction pattern from branched molecules
called dendrimers. Many tens of molecules self-assemble into spheres, and these spheres then form a
cubic structure that may be 20 or more nm across. In this case there is considerable disorder in the
atomic positions, but long range order in the positions of the spheres. Measuring such systems
requires instrumentation optimized for scattering at small angles but analysis techniques
closer to those traditionally used for crystallographic analysis.
|
|
Left: Small-angle diffraction pattern from dendrimers
self-assembled in the Pm-3n cubic phase.
Right: Small angle scattering patterns from carbide-derived
porous carbons as a function of chlorination temperature,
providing quantitative information on the size distribution
of pore sizes.
Source: LRSM
Multi-Angle X-ray Scattering Central Facility.
|
|
What are the components of an x-ray diffraction instrument?
Although there are many possible permutations, essentially all XRD instruments incorporate the
components shown in the following schematic: a means of producing the x-ray radiation, some
kind of collimation, something to support the sample (and possibly orient it or maintain a desired
environment), and a means for detecting the scattered radiation.
- Production of X-rays: There are a variety of methods for producing a beam of x-rays.
- X-ray Tube. This is
the simplest and oldest approach, and is still occasionally used. A beam of electrons strikes a metallic
target and X-rays are emitted. The intensity of the X-ray beam is limited by the heat released into the target by
the electron beam.
- Rotating anode X-ray Generator.
This variant of the traditional X-ray tube, which became widely available in the 1970's, addresses the heat loading problem by replacing
the fixed target with a rotating cylinder, water-cooled on the inside. Considerably more X-ray
intensity is thereby made possible, but there are both literal and figurative costs: the engineering requirements
are considerably more stringent, and rotating-anode generators are subject to breakdowns and require frequent maintenance.
- Microfocus Tube.
The most recent solution to the heat loading problem takes a different tack: the electron beam is focused down to a
tiny spot (typically 50 μm or less in diameter), so that the total heat load on the anode is quite small. Microsource
tubes started to become available around 2000, and are gradually replacing rotating anode generators.
- Synchrotron.
A synchrotron X-ray source uses a totally different mechanism from the tube sources described above: the radiation emitted
from a relativistic beam of electrons (or positrons) accelerated by a magnetic field. The resulting beam is generally many orders of
magnitude more intense than that produced by the tabletop sources described above. However, such a beam can be produced only at
a large centralized facility, obliging most users to travel substantial distances and plan their usage well in advance.
For this reason, tube/rotating anode/microfocus sources, which can be operated at the user's home institution, are best suited
for relatively routine measurements, while synchrotron sources are required for experiments requiring extremely high
intensity or other specialized conditions. Major synchrotron sources include
the Advanced Photon Source and
the National Synchrotron Light Source
in the US, the
European Synchrotron Radiation Facility in France, the
Diamond Light Source in Britain, and
the Photon Factory in Japan, among others.
- Collimation: The radiation produced by any of the above mechanisms consists in general of
rays traveling in a variety of directions and consisting of a spread of wavelengths. The purpose of the
collimation portion of an XRD instrument is to produce a relatively thin beam of X-rays with a narrow spread of
wavelengths, all traveling in essentially the same direction. Some commonly used components are described below.
- Slits or pinholes. These form a part of almost every instrument, and act by geometrically
restricting the beam. To be effective, they must be constructed from a heavy element such as tungsten. Care must
be taken to minimize diffuse ("parasitic") scattering from the edges of the slits which can contribute to the
background signal.
- Crystal monochromator. The most common method for producing a
"monochromatic" beam (containing only a narrow spread of wavelengths λ) is to
insert a high quality single crystal of a material such as silicon or germanium into the beam and
separate out only those components of the beam that satisfy
Bragg's Law. Conversely, for a beam that is already
largely monochromatic, this Bragg reflection from a crystal can be used as a means of collimation.
The degree of collimation and spectral selection depend on the perfection of the crystal and also the
characteristics of the incoming beam.
- X-ray Mirror. X-ray mirrors rely on the same effect referred to in our
discussion of X-ray reflectivity, namely that a beam which strikes a
flat surface at a very low angle can be strongly reflected. X-ray mirrors are typically made of a
metal such as gold and are gently curved so as to produce a beam that is focused along a vertical
and/or horizontal axis. They also affect the spectral characteristics since shorter wavelengths
are reflected much less effectively than long wavelengths.
- Multilayer Optics. This approach, which is incorporated in many units currently
on the market (especially those optimized for small-angle scattering) combines the benefits of
a crystal monochromator and an X-ray mirror. A multilayer coating on a curved substrate results
in a monochromatic, collimated beam, most often either parallel or slightly convergent focus.
The optical unit must be closely coupled with the source, but when done properly this can result
in a beam that is simultaneously more intense and better collimated than achievable with
previous technologies.
|
|
- Sample Support:
Clearly, the sample must be placed in the center of the beam. The exact means for achieving
this depends on the nature of the sample, which is quite often a small single crystal, a solid slab, a powder, a thin film
supported on a substrate, or a liquid. If the sample is a powder (i.e., orientationally disordered) or a liquid,
it is enough to place the sample in the beam. If single-crystal measurements are performed, the
orientation of the sample is also crucial, and is set and varied by mounting the sample on a goniometer.
Most measurements are made at room temperature, under ambient conditions. However, specialized instruments
may control the temperature of the sample, apply a magnetic field, shear the sample, etc.
- Detection: The last stage in any XRD instrument must be some means of detecting the
scattered X-rays. A rough historical progression of X-ray detection technologies follows:
- Film: For most of the 20th century photographic plates or films, generally coupled with some kind of
X-ray fluorescent screen, were the dominant method for measuring diffraction patterns. A collimated beam struck the sample,
and then the plate was placed behind the sample. This method was easy to deploy, but it was difficult to convert the
images to quantitative plots. Photographic plates are still often used in medical X-ray radiography.
- Scintillation Detector. Starting around the
1970's, film was largely replaced by solid state detectors, especially
scintillation detectors that produced an electronic
readout of the scattered intensity that could be directly read by a computer.
Because scintillation detectors generally measure the scattered intensity at only one angle at a
time, some type of collimation is necessary between the sample and the detector, often similar to that
found between the source and the detector. Systems employing "point detector" are thus
intrinsically somewhat slow, because only one angle is measured at a time, but are usually an improvement
over photographic film due to their high sensitivity and easy readout in digital form.
- 2D Detector. Two-dimensional, or "area" detectors
came into increasing use around 1990. A number of different technologies are available, but all of
them function essentially as "electronic film": like photographic film, they record the intensity
across an entire surface, but the resultant image is directly transmitted to the data-taking computer as
an array of intensities. In most cases, the intensity report for each pixel is an integer quantity, and is
equal or at least proportional to the number of X-ray photons that struck that pixel in a certain amount of time.
Area detectors combine many of the advantages of scintillation detectors and film. They are highly sensitive, and
can be read out rapidly, but measure the diffraction at many angles simultaneously. The volume of data produced
is thus greatly increased; a single data frame from an area detector generally occupies at least 1Mb of disk space,
and often 10 Mb or more.
|
How are X-ray area detector data analyzed?
The first step in a diffraction experiment using an area detector is to position the sample in the
X-ray beam such that diffracted rays strike the detector and then to expose the sample for a fixed amount of time.
The resulting area of intensities (usually photon counts) for each pixel on the detector is then read by the computer, and
displayed as a false-color image.
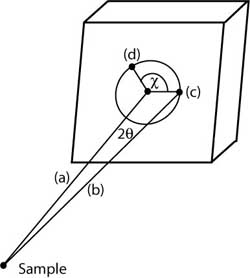
For quantitative analysis, the (x,y) pixel coordinates must be converted to more useful units.
The sketch to the right shows a common way of labeling the angles. A portion of the incident beam
generally passes through the sample undeflected--this is called the "primary beam". It is usually
necessary to have some kind of beamstop to block this beam from directly striking the detector, but the
position where it would hit is well defined. Then, relative to the beam center position,
other diffracted rays will be deflected by a scattering angle 2θ at an azimuthal angle χ as shown
to the right.
Instead of the scattering angle 2θ, the amount by which the scattered beam has been deflected
is often described by the
momentum transfer Q:
Q = (4 π / λ ) sin θ
The next steps depend on the kind of measurement being performed. Some of the more
frequently encountered measurements are single crystal scattering, powder diffraction, and solution SAXS:
- Single Crystal: For single crystal measurements, the pattern on the detector
will consist of a large number of sharp spots. The analysis software must determine the position
(2θ, χ) of each spot and the total (integrated) intensity within that spot. This measurement is then
repeated for many different sample orientations. Detailed analysis (beyond the scope of this article)
can then invert this information to determine the atomic positions within the sample.
-
Powder diffraction For powder diffraction the pattern on the detector will consist of a set of
concentric sharp rings. In this case the intensity is independent of χ. For further analysis, the
2D image is reduced to an x-y plot consisting of the intensity per pixel as a function of 2θ, or Q averaged over
all values of χ. Producing a plot of this sort (with the option for export to other applications) is one of
the central capabilities of Datasqueeze.
The next task is to produce a list of scattering angles and intensities for each peak (overlapping
peaks can be a problem). A commonly used approach is to perform a
least-squares fit to the pattern, modeling each peak as a
Gaussian or similar function together with a smooth background.
-
Solution SAXS
For small angle scattering from particles embedded in a liquid or solid matrix, the scattered intensity
is again independent of χ, and again the
2D image is reduced to an x-y plot consisting of the intensity per pixel as a function of 2θ, or Q averaged over
all values of χ. In this case a smooth pattern without sharp peaks is generally observed,
but
least-squares fits
can be used to compare the observed pattern to the functional forms predicted for the size and shape
of the individual particles. For example, the intensity predicted for scattering from uniform solid spheres
of radius R
is the square of the "Rayleigh Function":
I = (const) | P(Q) | 2
P(Q) = ( sin ( q R) - Q R cos(Q R) ) / (Q R )3
Datasqueeze incorporates a wide selection of functions used for
fitting SAXS data.
|
|
Diffraction geometry for a 2D X-ray detector.
(a) Undeflected (primary) beam.
(b) Beam scattered at angle
2θ.
(c) Spot on detector produced by beam at deflection
angle 2θ and azimuthal angle χ=0.
(d) Spot produced by beam at deflection angle 2θ and azimuthal angle χ .
|
|
What is involved in calibrating an XRD instrument with an area detector?
Our discussion of X-ray data analysis makes it clear that a number of parameters must be accurately determined
to perform any meaningful analysis. The first, which is not really a detector characteristic, is the
wavelength λ. This depends on the characteristics of the X-ray source and collimation.
The image to the top right shows the typical geometry for an area detector-based apparatus. We need to accurately
map the (x,y) coordinates of a detector pixel to (2θ,χ).
The first parameter that must be established is the exact position on the detector where the primary beam hits (or, would
hit if it were not blocked by the beamstop). You might think that visual examination of that region of the measured
image would be good enough--for example, one could choose a pixel in the middle of the shadow provided by the
beamstop. However, it turns out that this is not good enough; for accurate measurements one needs to know the
beam center position to within a fraction of one pixel size.
To interpret a radial distance from the beam center to a particular pixel, we also need a scale factor: the relationship
between the width of one pixel and the scattering angle 2θ. We can get a good approximate idea of this factor
if we know the distance between the sample and the detector and the dimensions of each pixel (or, equivalently,
the sample:detector position and the dimensions of the entire detector).
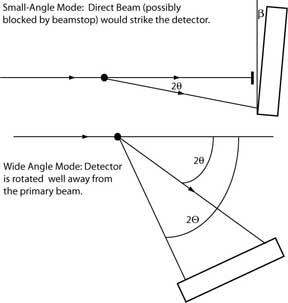
Another issue to consider is the issue that the detector face may not be exactly perpendicular to the primary
beam, but be rotated away by some small angle β as shown on the figure to the top right. This will have the effect of converting circular Bragg rings
into ellipses on the detector.
One of the best solutions to the accurate determination of these parameters, which is employed by the
Datasqueeze calibration wizard, is to use
the Bragg rings of a known calibration standard. By using the fact that these rings must be centered
on the primary beam position, must be circular, and must appear at known values of
2θ, it is possible to establish all of the calibration parameters to high accuracy.
An obvious limitation of the configuration just discussed is that the detector has a limited angular range.
The smallest scattering angle is determined by the beamstop size: if D is the diameter of the beamstop and
L is the sample-to-detector distance then the minimum scattering angle is given by
2 θminimum = tan-1 (D / 2 L )
Similarly, the widest achievable angle, for a detector of width W (with the beam center in the center of
the detector) is approximately given by
2 θmaximum = tan-1 (W / 2 L )
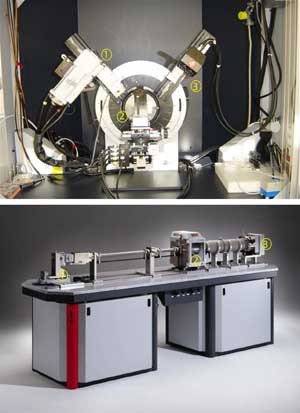
If this spread in minimum angles is insufficient, the most common solution is to make measurements at
multiple sample-detector distances. However, another solution is shown on the bottom right: the detector is
mounted on a moveable arm and rotated through some large angle 2 Θ. After stepping through many values of
2 Θ to obtain overlapping patterns, a complete profile of the scattered intensity over a wide scattering angle range can
be obtained. However, the conversion between (x,y) pixel location and angular coordinates
(2θ, χ) becomes more complicated. For example, Bragg "rings" now become more generally conic
sections.
Datasqueeze is unusual in providing software to accurately interpret such data.
|
|
Top: Typical configuration for an XRD apparatus
incorporating an area detector.
The direct beam is
prevented by a beamstop from striking the detector.
The detector face is
close to but in general not perfectly
perpendicular to the direct beam.
Bottom: Wide-angle configuration, in which the detector
is mounted on a moveable arm that rotates it
well away from the direct beam.
|
|
References and further reading.
A variety of useful links have been provided in the text above. The following books and articles
are recommended for those seeking a more in-depth understanding of the topics discussed in this article.
-
B. D. Cullity and S. R. Stock, Elements of X-ray Diffraction, Pearson, 2001 . A classic text on XRD,
reissued multiple times.
-
B. E. Warren, X-ray Diffraction, Dover Publications, 1969 . Another classic text, at a slightly higher
level than Culllity.
-
B. B. He, Two-dimensional X-Ray Diffraction, Wiley, 2009. A thorough and readable
discussion of all aspects of X-ray scattering using area detectors.
- A. Guinier and G. Fourner, Small-angle scattering of X-rays, Wiley, 1955. Out of print
and hard to find, but a wonderful reference if you can get hold of a copy.
-
L. A. Feigen and D. I. Svergun,
Structural Analysis by Small-angle Scattering of X-rays and Neutrons, Springer, 1987. A more modern
survey of SAXS techniques.
-
Th. Zemb and P. Lindner, eds., Neutron, X-rays and Light. Scattering Methods Applied to Soft Condensed Matter, Springer,
2002. A collection of thorough and pedagogical articles on many aspects of XRD, especially including SAXS.
-
J. Als-Nielsen and D. McMorrow, Elements of Modern X-ray Physics, 2nd Edition, Wiley, 2011.
A survey of modern techniques of x-ray scattering and diffraction, with an emphasis on
synchrotron-based techniques.
Last updated September 4, 2023
Send Us Your Comments/Inquiries