| Home | UPenn E-Portfolio | CHEM 501 |
CHEM 502 |
CHEM
503 |
EDU 536 |
CHEM 505 |
CHEM
506 |
CHEM 507 |
EDU 636 |
CHEM 504 |
CHEM 508 |
| Chemistry
501-Arrhenius Equation Assignment |
Justin Barry
Dr. Bryan Roberts
8-10-06
Data Analysis Exercises: Arrhenius Equation
INTRODUCTION
In this data analysis exercise, Arrhenius’ equation will be examined based on the data taken from Hecht & Conrad (1889) for the reaction of ethoxide and methyl iodide. Arrhenius examined several sets of data for the reaction rates at varying temperatures. He then proposed an equation that represented the data. The equation is known as the Arrhenius equation:
rate
= Ae-Ea/RT .
The equation is
based on taking the ln rate vs 1/T (in Kelvin) and finding the equation
for the
best fit line. Based on the equation
above, the slope of the line is related to the activation energy. In addition, based on the graph of various
reaction rates, one can determine the activation energy of a chemical
equation. OBJECTIVE
The objective of this project is to verify that Arrhenius’ findings are correct. We will use the data from Hecht & Conrad (1889) for ethoxide and methyl iodide to determine the best fit line and find the activation energy of the reaction.
DATA
TABLE 1: Data from Hecht & Conrad (1989)
|
||||||||||||||||||||||||||||||||||||||||
GRAPH OF DATA USING EXCEL
CHART
1


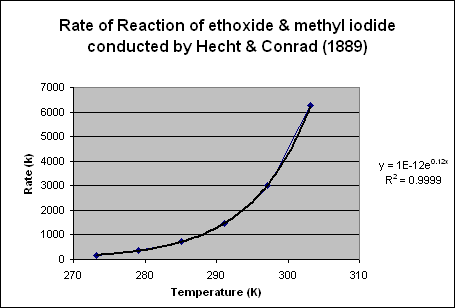
The data in Table 1 indicates the temperature, rate of reaction, and 1/temperature, and the ln of k. A plot (Chart 1) of the rate vs temperature indicates that the relationship of ethoxide and methyl iodide is an exponential function. A best fit line and determination of an equation yields y=1*10-12 *e0.12x . This equation is very similar to Arrhenius’ equation.
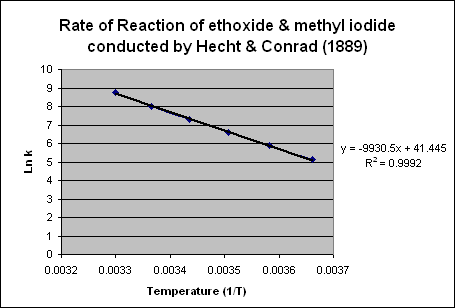
Then, the data of ln k vs 1/temperature was graphed and a best fit linear line was used. The equation yielded y = -9930.5x + 41.445. The slope is equal to –Ea/R because:
rate=
Ae-Ea/RT
ln rate = lnA + -(Ea/R)
Using the equation from Chart 2, one can set the slope, -9930.5 equal to –(Ea/R). Solving for Ea, the activation energy is 82,562.18 J. Converting to kJ, the activation energy of the reaction is 82.56 kJ.CONCLUSIONS
Using the Arrhenius equation, one can use the rate constants to solve for the activation energy of a reaction at varying temperatures. Hecht & Conrad conducted an experiment in 1889 for the reaction of ethoxide and methyl iodide. They recorded the rate of reaction versus the temperature. The ln k vs. 1/temperature can be graphed and the slope can be compared to –(Ea/R) (from Arrhenius’ equation). Therefore, we can determine the activation energy from the rates of reaction.
Home Page