By: Mark A. Bruder
Boyle's Law
Introduction:
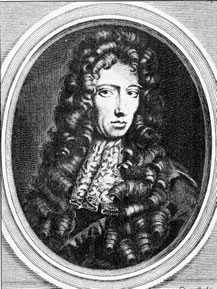
Robert Boyle who is also referred to as "Father of Modern Chemistry" did a lot of different work in the field of physics and chemistry during his lifetime. In 1660, Boyle published a scientific report, The Spring and Weight of the Air in which he first described different experiments he created using a new vacuum pump which he designed.
In 1662, Boyle published his second version of The Spring and Weight of the Air. In this version with help from his assistant Robert Hooke, this is were he described the inverse relationship between pressure and volume. This relationship is now known as Boyle's Law. Boyle's Law states that pressure and volume are inversely proportional to each other. As the pressure increases the volume decreases and vice versa. He made these observations by using Mercury in a J-tube and made measurements of the volume of the trapped gas at pressures both higher and lower then normal atmospheric pressure.
Boyle expressed his results in a relationship that is known as Boyle's equation: P1V1 = P2V2 assuming the temperature remains constant.
Purpose:
The purpose of this exercise is using Boyle's original data obtained from the website http://webserver.lemoyne.edu/faculty/giunta to verify that Boyle's Law stating that pressure and volume are inversely proportional to each other assuming temperature remains constant is true.
Data:
Figure 1: Boyle's Data
Figure 2: Pressure vs. Volume Graph
Figure 3: Pressure vs. Inverse Volume
Analysis:
To verify Boyle’s Law which states that pressure and volume are inversely proportional to each other assuming the temperature remains constant is accurate, I needed to obtain a data table that Boyle used in 1662 to present his findings. This data was obtained from the website http://webserver.lemoyne.edu/faculty/giunta and the information was placed into a excel data table and a graph was constructed.