|
|
| Project Home History Concepts & Theory Collecting Data Lesson Materials |
Introduction
The following information relates to the process of gathering
data. It provides a general overview of the process from growing
the crystals to solving the structure. |
 |
Growing Crystals
|
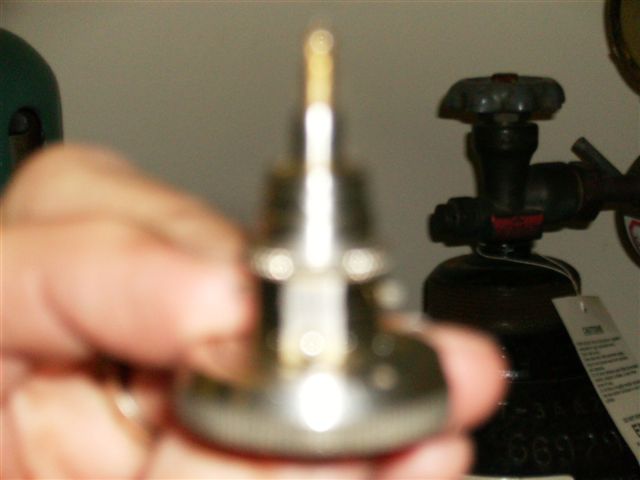
Many chemists are familiar with crystallization techniques used to isolate compounds in lab. Few are familiar with the more difficult task of developing crystals that are useful for x-ray crystallography. The size and quality of the crystal are extremely important, as most problems that occur in the process are somehow related to faulty crystals. Crystallographers determine the best method for growing crystals based on the chemical properties of the substance that is to be analyzed. Paul Boyle of North Carolina State University has written extensively on growing crystals. He authored a useful website that answers frequently asked questions about growing crystals. Below is a picture of some of the samples of crystals that were waiting to be analyzed when I visited the x-ray facility at the University of Pennsylvania. 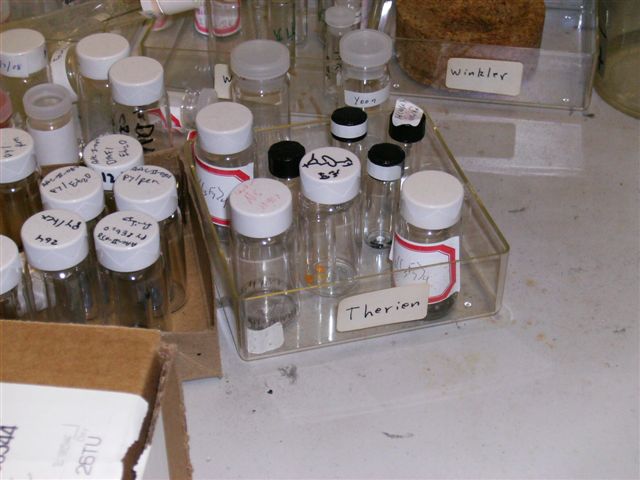 Generally, each side of a crystal should be less than one-half millimeter in length. This is because the beam of x-rays is comparable in size. The crystallographer examines the crystal under a high-powered lens to ensure that it is suitable for analysis. Razor blades are used to shave the crystals. When an appropriate sample is obtained, it is mounted on the end of a very fine wire as pictured below. 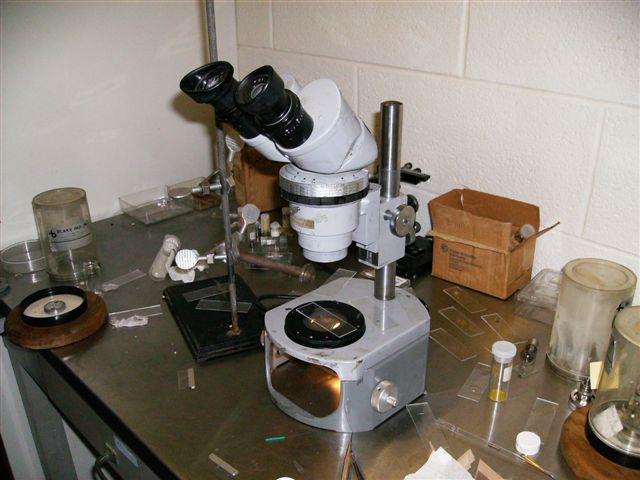
 |
|
 |
Analysis with Diffractometer
|
A typical diffractometer contains several important parts. The following image comes from the facility at UPenn and was borrowed from Dr. Carroll's Online X-Ray Course: 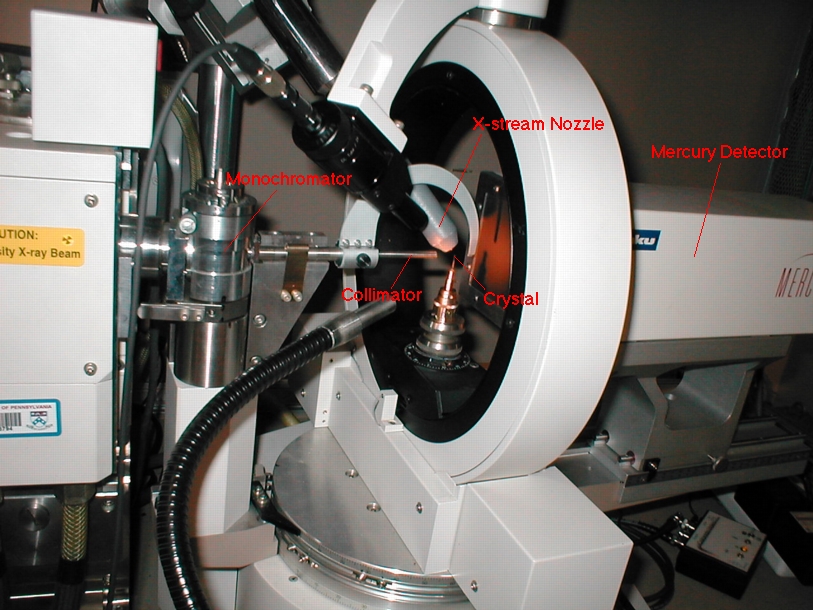 According to the facilities
website, this particular instrument is a "Rigaku RUH2R 12kW rotating
anode generator equipped with mercury CCD
area detector with RigakuMSC's X-stream 2000 Cryogenic Crystal Cooling
System for low temperature capabilities." As with other
instruments that transmit and measure forms of light, the
diffractometer has a monochromator that allows that user to set a
narrow range of wavelengths for the x-rays that are emitted and a
collimator that focuses the beam. Additionally, the instrument
has an x-stream nozzle that cools the crystal during the x-ray
exposure. The mercury detector contains a charged-coupled device,
or CCD detector. The x-rays that end up in the detector are
converted to visible light. This light shines on a screen which
outputs an electrical charge that is proportional to the intensity of
the light that landed on the screen. The electrical charge sends
a signal that is collected by the computer.
Several parts of the diffractometer rotate at several different angles. This allows for the maximum number of reflections to be collected, which provides more information about the orientation of the atoms in the crystal. |
|
 |
Solving the Structure
|
The International Union of Crystallography has an education site that offers a wealth of information aimed at individuals with limited backgrounds in mathematics. Much of the material below has been synthesized from that collection. The educational pamphlets may be viewed and copied for educational purposes. Background C.A. Lewis, Analysis Each spot that is detected by the diffractometer results from x-rays that are diffracted through planes within the unit cell which are defined by ordered triplets called Miller Indices (hkl). The intensity of each of these spots is proportional to a quantity called the structure factor as shown below in the proportionality from Kapecki: 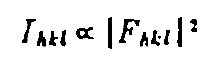 The structure factor
provides the crystallographer with information about the amplitude and
phase of the electron density within the unit cell. The following
equation relates electron density, rho, to the structure factor:
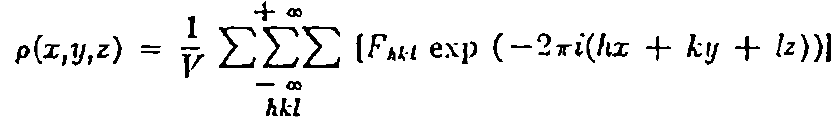 Unfortunately, the process is
complicated greatly by the fact that important phase information is
lost due to the nature of the structure factor calculation. This
is often referred to as the "phase problem" in crystallography.
Solutions to this problem, along with other mathematical techniques
involved, are well beyond the scope of this project. For
additional introductory information, visit the IUCr educational
pamphlet entitled, "Introduction
to the calculation of structure factors," which was written by S.C.
Wallwork.
|
|
ReferencesBoyle, P. (n.d.). Appendix A. In Growing crystals that will make your crystallographer happy [Brochure]. North Caronlina State University Department of Chemistry. Bruker-Axs. (n.d.). Diffractometer [Data file]. Retrieved April 3, 2009, from http://serc.carleton.edu/images/research_education/geochemsheets/techniques/BrukerK3_for_web.jpg Carroll, P. J., & Carroll, M. H. (n.d.). Structure Determination by X-ray Crystallography . In University of Pennsylvania X-Ray Crystallography Facility [Online Course]. Retrieved January 7, 2009, from http://macxray.chem.upenn.edu/course/index.html Sommer, B. (2005). Crystal lattice [Data file]. Retrieved April 3, 2009, from http://www.sintef.no/upload/Materialer_kjemi/Syntese%20og%20egenskaper/XRD-BN(Bk)-crystal.jpg
Kapecki, J. A. (1972). An introduction to x-ray structure determination. Journal of Chemical Education, 49(4), 231-236. University
of
Cambridge. (2002). X-ray diffraction. In Cavendish Laboratory
educational
outreach. Retrieved March 30, 2009, from
http://www-outreach.phy.cam.ac.uk/camphy/xraydiffraction/xraydiffraction_index.htm |