Worldwide patterns of human epigenetic variation

Paper: https://www.nature.com/articles/s41559-017-0299-z

Abstract: DNA methylation is an epigenetic modification, influenced by both genetic and environmental variation, that can affect transcription and many organismal phenotypes. Although patterns of DNA methylation have been shown to differ between human populations, it remains to be determined whether epigenetic diversity mirrors the patterns observed for DNA polymorphisms or gene expression levels. We measured DNA methylation at 480,000 sites in 34 individuals from five diverse human populations in the Human Genome Diversity Panel, and analyzed these together with single nucleotide polymorphisms (SNPs) and gene expression data. We found greater population-specificity of DNA methylation than of mRNA levels, which may be driven by the greater genetic control of methylation. This study provides insights into gene expression and its epigenetic regulation across populations and offers a deeper understanding of worldwide patterns of epigenetic diversity in humans.


Context of genetic population clustering

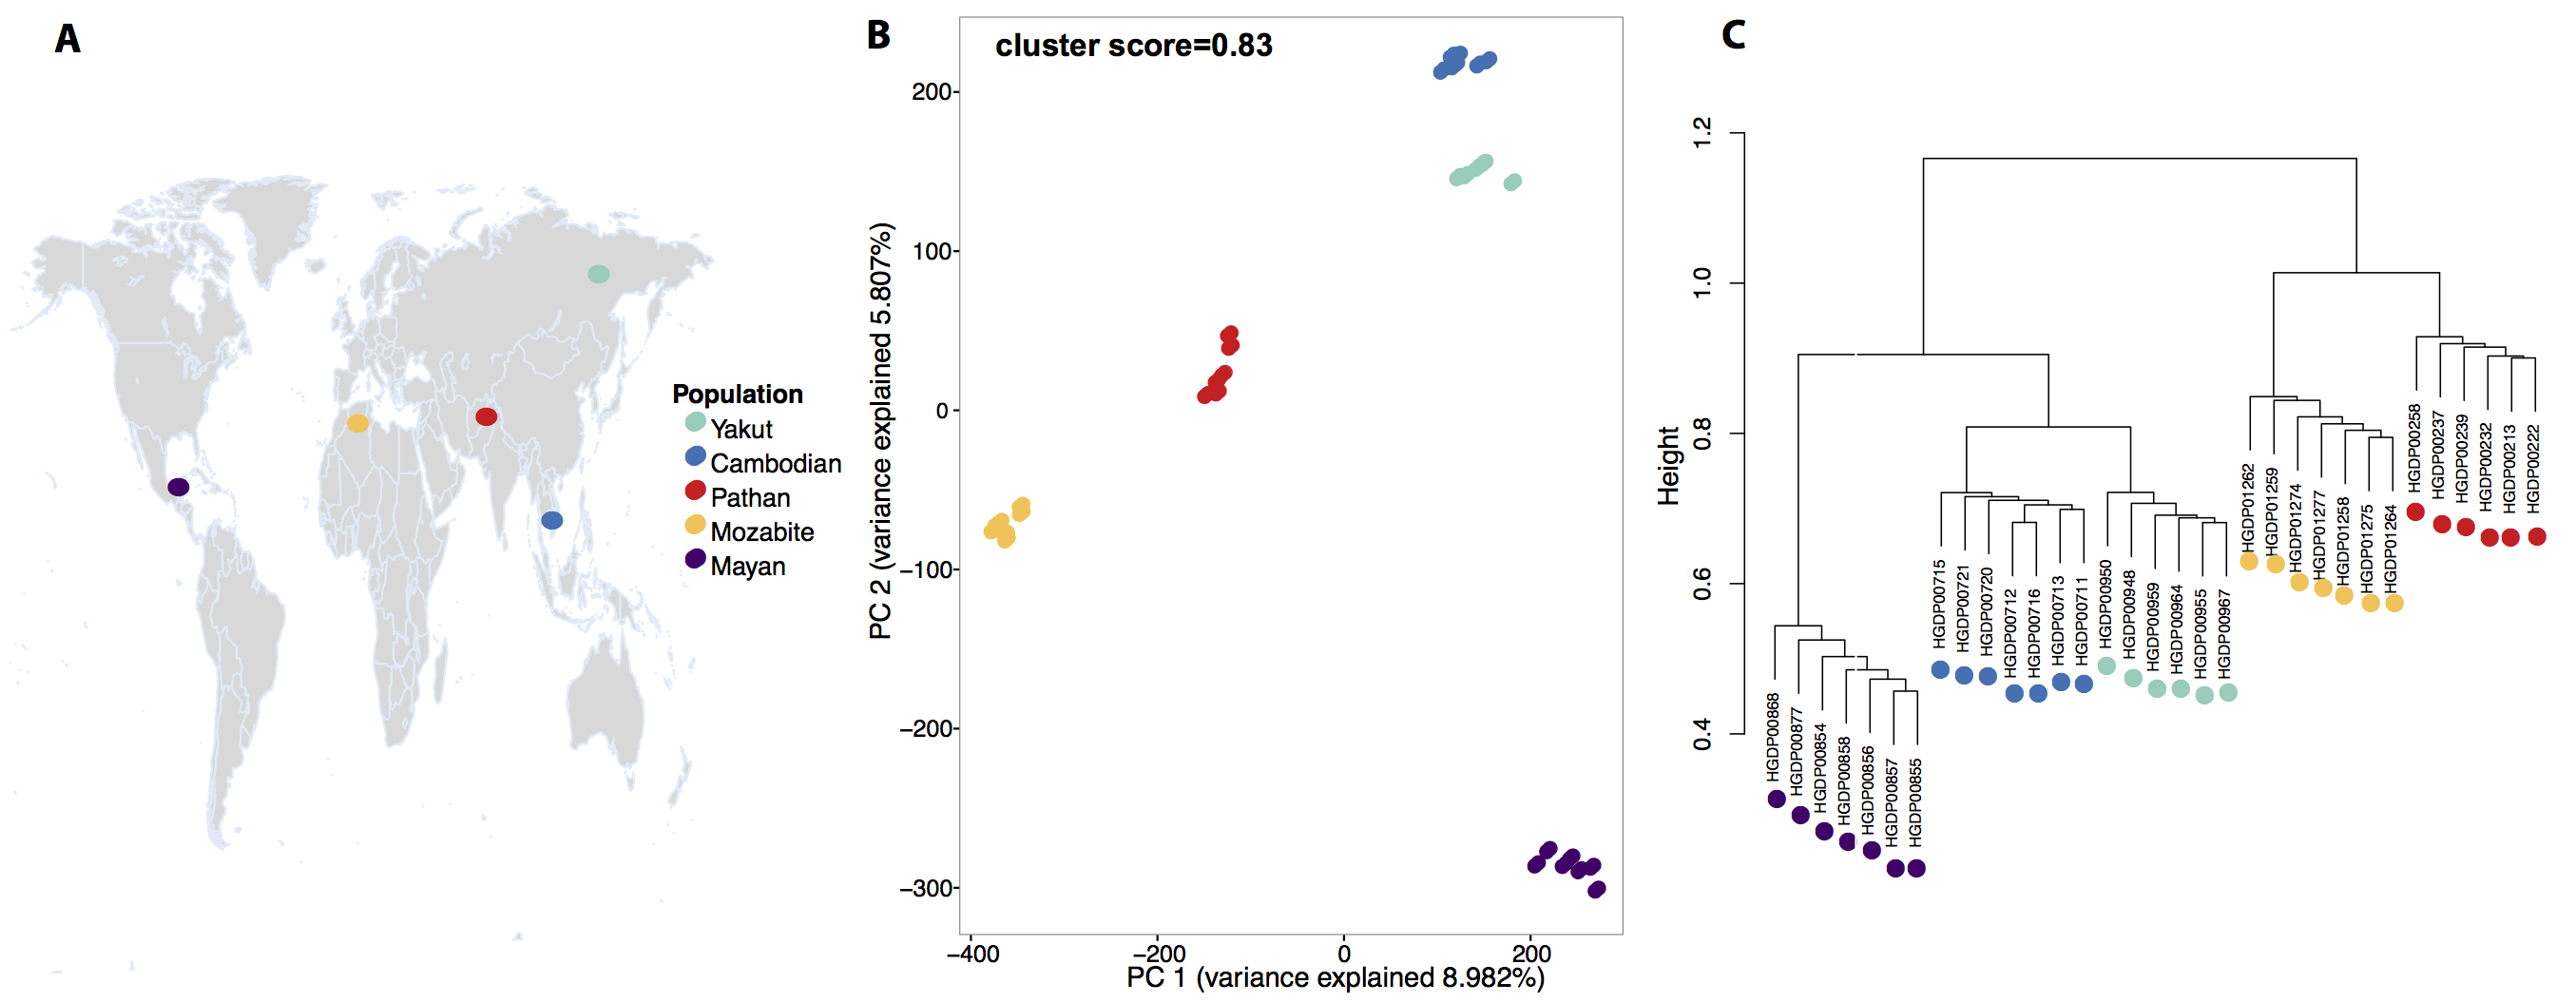
To characterize genetic divergence between these populations, we carried out PCA on the SNP genotype matrix. The first and second principal components clearly differentiated the individuals into five well-separated clusters that correspond to the five populations sampled. Even with the limited sample size, the population structure revealed by the SNP genotypes is extremely robust. To facilitate comparison between the genetic and epigenetic datasets we quantified the strength of the genomic PCA clustering by computing the Silhouette cluster scores (SCS) for the individuals in the five populations as well as the average SCS for the entire data set (Supplementary Figure S1). The SCS of an individual measures how similar it is to its own predefined population cluster, relative to individuals in other clusters, while the average SCS across all individuals is a measure of how tightly the data correspond to their known populations. For the genetic clustering presented in Figure 1B this score is 0.83, and the median is 0.9. A tree generated using hierarchical clustering also captures the genetic relationships between the individuals and their populations (Figure 1C). The branching pattern of this tree agrees with the accepted order of ancestral human expansion, consistent with the “out of Africa” hypothesis.


Epigenetic population clustering

To estimate epigenetic divergence, we computed Pst, the phenotypic differentiation between populations, for DNA methylation and mRNA levels across the genome. This measure estimates population differentiation for quantitative traits, analogous to Fst (see SI: Methods and Materials). Selecting the top 0.05% of CpG sites with the highest population divergence in DNA methylation (i.e., the highest Pst values), we performed PCA to assess patterns of epigenetic variability between the five different populations. These methylation levels cluster individuals by population, similar to the SNP data but with a lower Silhouette cluster score (mean = 0.30, median = 0.40). Repeating this analysis using mRNA expression levels for the same number of genes exhibiting the highest population divergence resulted in qualitatively similar clustering patterns, though with a lower Silhouette cluster score. We observed a lower SCS for the gene expression data at a wide range of cutoffs, and also when using the smallest K-W p-values to select genes and CpG sites for the analysis (Supplementary Figure S2). These results suggest that DNA methylation is more closely linked to population histories than is gene expression.

Play with epigenetic population clustering

Select the number of CpG sites to use for the PCA.

Select the number of mRNA sites to use for the PCA.


© 2017 Oana Carja