|
Measuring Spectra |
Initially, astronomy was the study of the
stars, planets, and other celestial bodies by way of the
telescope. While this offered a grand view of the sky's patterns
during different seasons, the only detailed information that could be
retrieved was the faint color of a few planets and markings on the moon.1 The astrophysicists of the late 1940s and
1950s began to assemble tools to view space with more precision to
ensure a sizable data collection. One of the first astronomers to
take his knowledge of star gazing and starlight to the level of
spectroscopy was a man by the name of Walter L. Semerau. His
first spectrograph was procured using parts of a telecscope,
astrographic camera, monochromator, and spectrograph. Figure 1 is a graphic
representation of Semerau's first spectrograph by Walker. A more
complete history of Semerau's accomplishments can be found here.
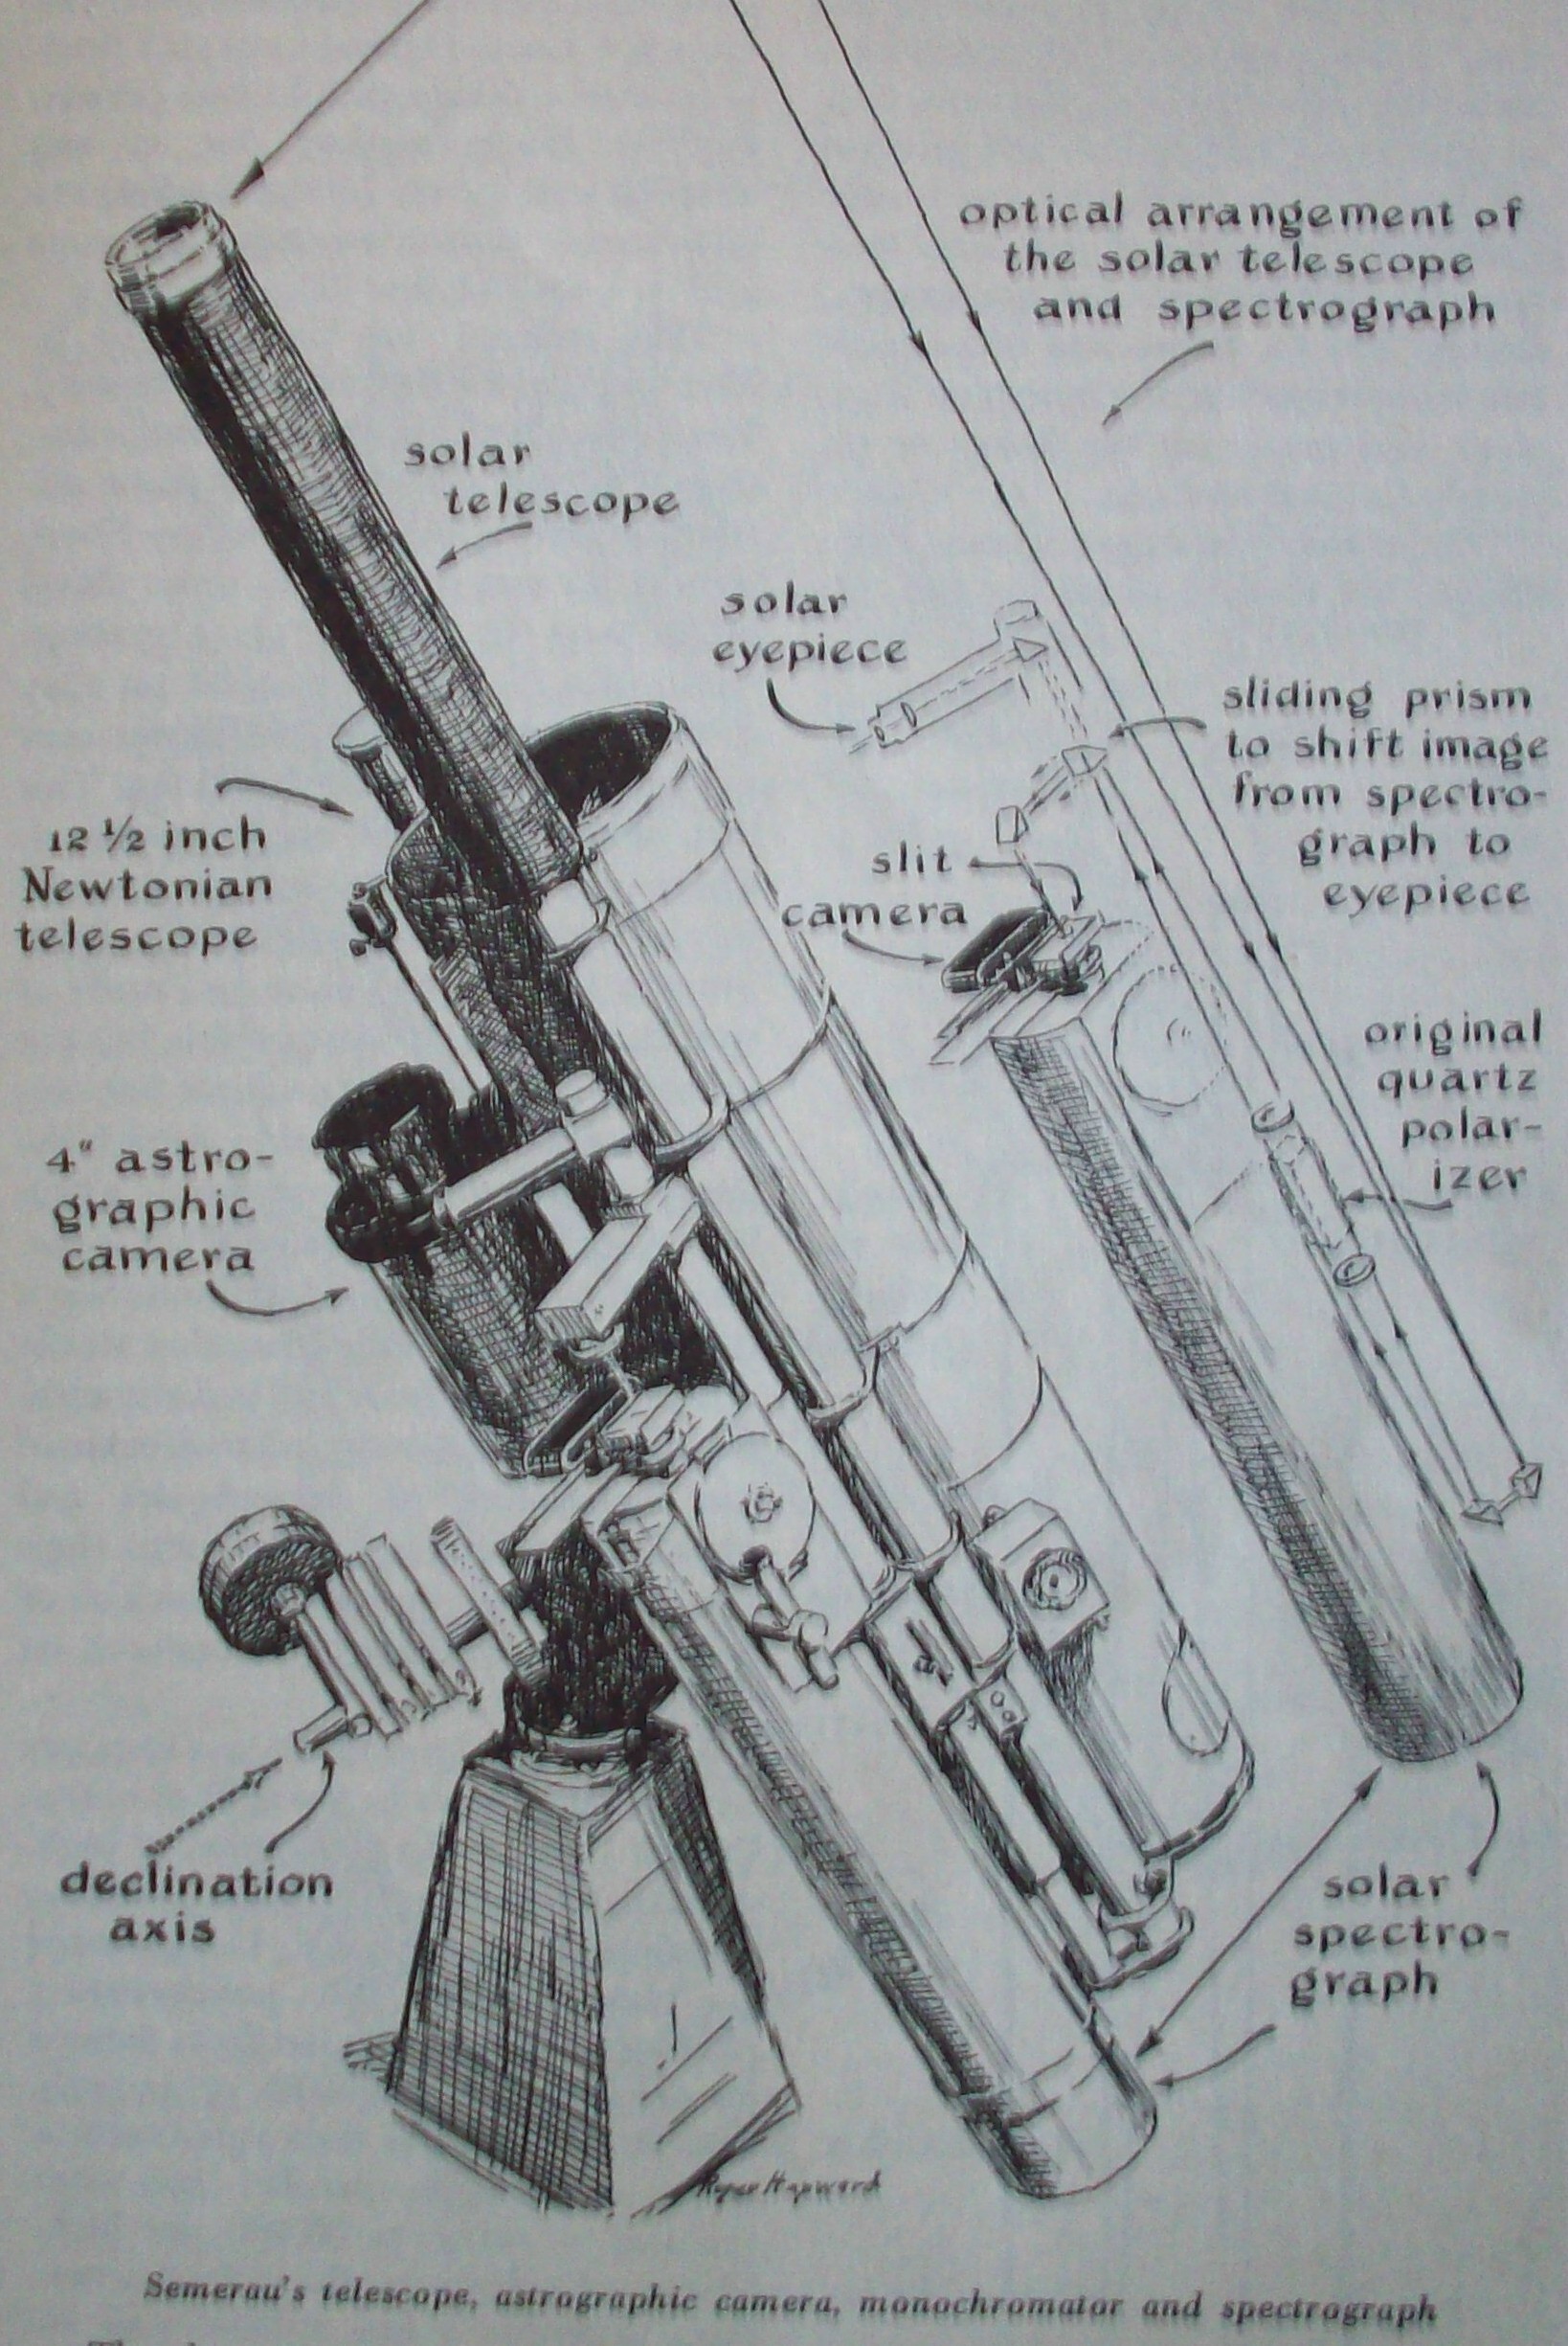
First, Semerau's tool included the attachment of a monochromator. This piece conceals the the sun so that only the solar atmosphere can be observed. Next, the spectrograph was developed. As Walter maintains, this new spectrograph can and would presumably "function as a yardstick, speedometer, tachometer, balance, thermometer and chemical laboratory all in one."1 The spectrometer functions as light falls on the optical element and is concentrated through a series of lenses and a thin slit. It is dispersed into its fundamental wavelengths by either a prism or a diffraction grating onto a white background. The collection of colors emitted is that body's spectra.1 Today's spectrometer's use diffraction gratings instead of prisms for two important reasons. Some of the photons from the light source are absorbed by prisms which can create a spectrum less precise to astronomers. Secondly, prisms don't disperse light linearly as diffraction gratings do. The rafracting of the light, instead of reflecting causes more bluer wavelengths and less red wavelengths in the spectra.2 A common spectrometer for obtaining astronomical information in depicted in figure 2.

Figure 2. A common Spectrometer designed to capture the spectra of celectial bodies.
This diagram is displayed in Australia's Telescope Outreach and Education Home Page
credited to James B. Kaler, in "Stars and their Spectra," Cambridge University Press, 1989.
References:
Figure 1. Walter L. Semerau's Spectrograph
First, Semerau's tool included the attachment of a monochromator. This piece conceals the the sun so that only the solar atmosphere can be observed. Next, the spectrograph was developed. As Walter maintains, this new spectrograph can and would presumably "function as a yardstick, speedometer, tachometer, balance, thermometer and chemical laboratory all in one."1 The spectrometer functions as light falls on the optical element and is concentrated through a series of lenses and a thin slit. It is dispersed into its fundamental wavelengths by either a prism or a diffraction grating onto a white background. The collection of colors emitted is that body's spectra.1 Today's spectrometer's use diffraction gratings instead of prisms for two important reasons. Some of the photons from the light source are absorbed by prisms which can create a spectrum less precise to astronomers. Secondly, prisms don't disperse light linearly as diffraction gratings do. The rafracting of the light, instead of reflecting causes more bluer wavelengths and less red wavelengths in the spectra.2 A common spectrometer for obtaining astronomical information in depicted in figure 2.
Figure 2. A common Spectrometer designed to capture the spectra of celectial bodies.
This diagram is displayed in Australia's Telescope Outreach and Education Home Page
credited to James B. Kaler, in "Stars and their Spectra," Cambridge University Press, 1989.
|
How can white light be dispersed? Use the diagrams to help with your explanation. |
References:
1. Walker, J.
Light
and its Uses: Making and Using
Lasers, Holograms, Interferometers, and
Instruments of Dispersion. W.H. Freeman:
2. Australia Telescope Outreach and Education. Obtaining Astronomical Spectra -
Spectrographs. CSIRO: Australia, 2004.
http://outreach.atnf.csiro.au/education/senior/astrophysics/spectrographs.html
(accessed March 4th 2008).