The spectrum of celestial bodies tells astronomers what kind of
substances are found in the inside of the star or planet as well as
what kinds of gases are surrounding it. This information is
helpful in comparing both atmospheres between Earth and other planets
in our galaxy as well as comparing the composition of other stars with
our Sun. In order to collect this data, a spectroscope
is used to capture the light. Once the light is broken up into
its constituent wavelengths, a spectrum is produced. There exist
three types of spectrum important for review in Astronomy. These
three types of spectra are organized into a series of laws relating
both concepts of emission and absorption, known as Kirchhoff's Laws of
Spectroscopy. Gustav Kirchhoff and Robert Bunsen were the first
physicists to deduce the the meaning of the patterns produced by spectra1.
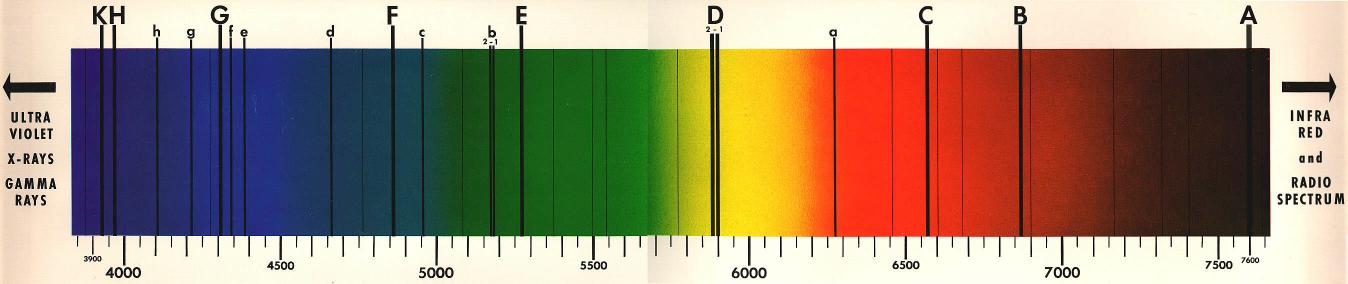
Figure 1 below is an example
of such spectra produced by the sun in which there is a clear variety
of wavelengths represented by the spectrum of colors as well as a
series of dark lines of different widths.2
Figure
1 Spectra of the Sun.
Credit to Spacetech's Orrery
Since the mid 19th century, scientists understood the range of colors
appearing in a spectrum like this corresponded to the range of
wavelengths the light source was emitting. The dark bands
splitting the colors, called Fraunhofer lines after the man who first
noticed them, were however a mystery. Kirchhoff and Bunsen set
forth to determine the meaning of these dark bands in spectra.
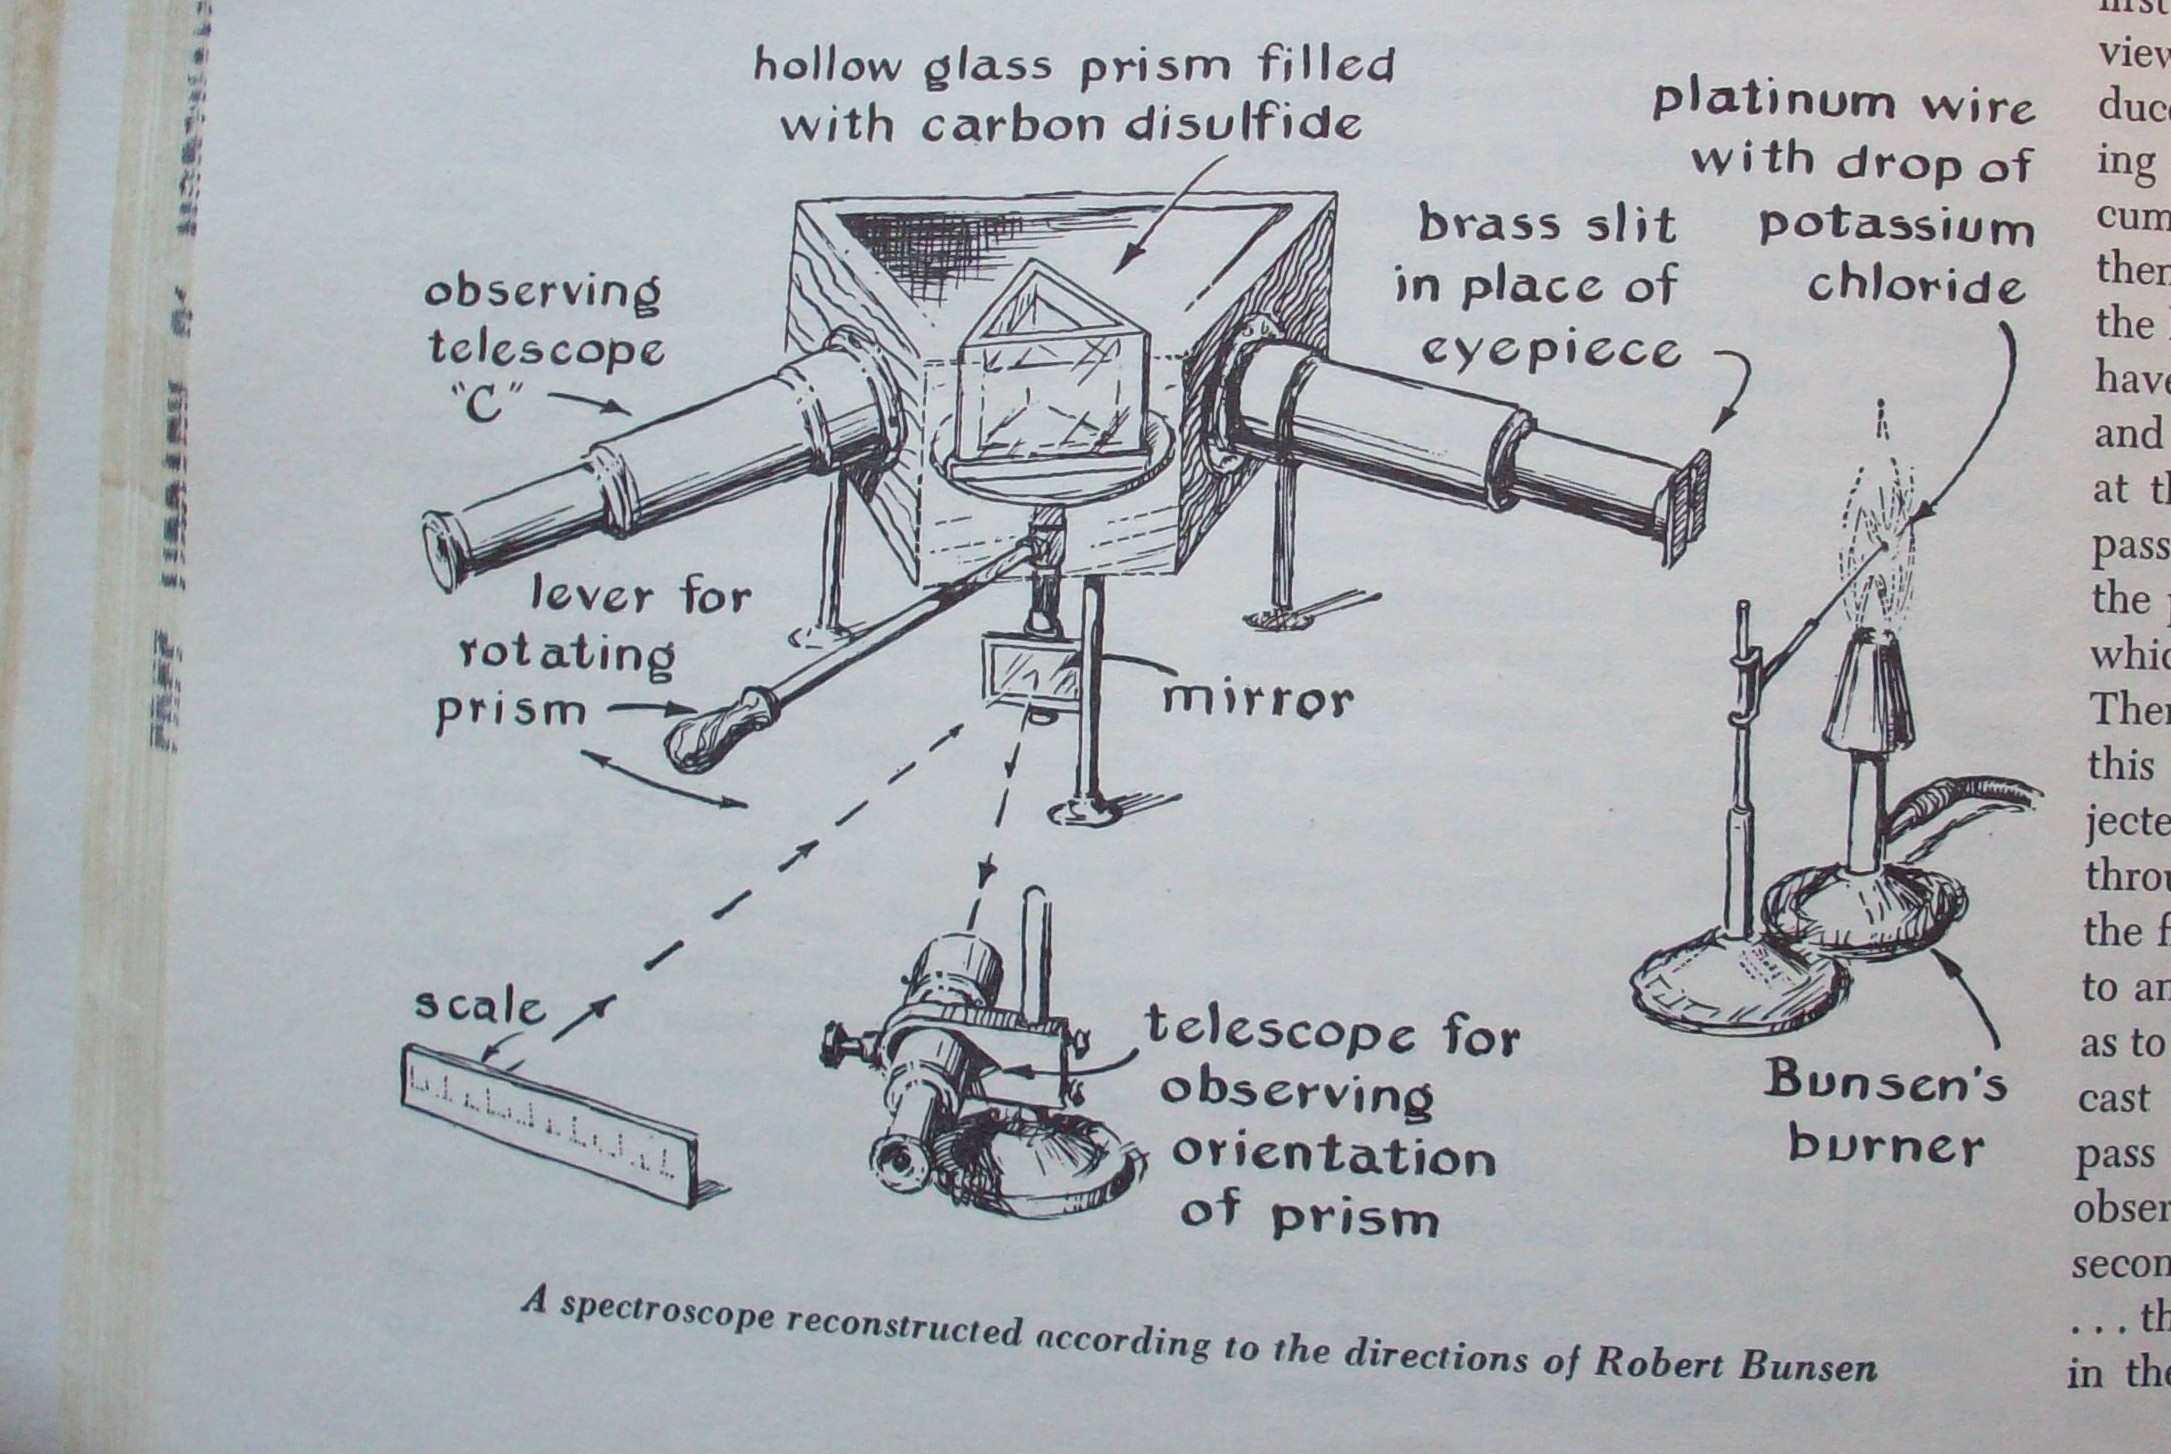
Upon creating a makeshift spectroscope including an observing
telescope, prism, and Bunsen's own burner to produce light (figure 2), Kirchhoff developed a
three piece law series from which astronomy has lain its foundation.1
Figure
2. Spectroscope created by Gustav Kirchhoff and Robert Bunsen
Kirchhoff deduced that hot solids, liquids, and gases under high
pressure radiate a continuous spectrum, the black body radiation curve.
He also noted hot gases under lower pressure produce tiny peaks of
color throughout a spectrum, called emission lines or bright line
spectra. The energy emitted by these molecules due to their
kinetic motion is not enough to create a full spectrum targeting each
wavelength, but small portions of the spectrum. Lastly, he
realized that cooler gases surrounding the object in focus absorb some
of the energy being released by the black body radiating.
Thus, a spectrum where some wavelengths are omitted in the form of tiny
dark bands are produced.1 These are
known as absorption or dark line spectra because of their
appearance.
First Law:
Continuous Spectrum
|
Second Law:
Emission Spectrum
Brightline
|
Third
Law: Absorption Spectrum
Darkline
|
Hot
bodies radiate a continuous spectrum
|
Hot
gases under lower pressure emit
energy in certain regions of the spectrum
|
Cooler
gases absorb some of the
energy radiating from the hot body.
|
Kirchhoff's Laws
|

|
Figure 3 (Left) Illustrates
visually Kirchhoff's Laws of Spectroscopy.
The first spectrum is a continuous collection of wavelengths from the
radiation of a heated body.
The second is a brightline emission spectrum illustrating the
wavelengths a particular gas emits.
The third is a darkline absorption spectrum showing the wavelengths
that would be aborbed if the gas above were cooled.
|
Figure 3. Kirchhoff's Law's Illustrated.4
Stars, nebulae, and planets in space produce a continuous spectra
because of the heat energy they radiate.
The dark lines in the spectra produced from the absorption
of some of
the energy serve as evidence that cooler gases surround the
bodies.3 The energy an
electron absorbs to jump
to
the next level equals the amount of energy re radiated when the
electron
falls back to the ground state. In this way, astronomers can
assume the gases absorbing
the black body's radiation will produce a brightline spectrum in the
same areas as the darkline spectrum.3
By
measuring the wavelengths of radiation, an astronomer can tell what
type of gas is surrounding the radiating celestial body.
As we have discussed, hot bodies radiate much more energy than
what simply exists in the visible spectrum. As such, astronomers
need a system to measure spectra that cannot be seen. Spectra is
often recorded in three series, Lyman series, Balmer series, and
Paschen series.3 Each series corresponds
with the transition of an electron to a lower orbit as a photon is
emitted. Using the hydrogen atom as a model, astronomers have
named the spectra recorded during a transition of an electron to the
ground state, the Lyman series.3 This series records emission
wavelegths in the ultra violet region because the energy and wavelength
emitted is so powerful. The transition from an excited electron
to the second level is not quite as big a jump and so it can be
recorded in the visible spectrum above.3
The third series records emission lines from transitions to the third
orbit, a much smaller jump resulting in the longer weaker waves of the
infrared spectrum. These three series of spectra are important in
examining the physical and chemical properties of both stellar and glaxy
spectra. Figure 4
illustrates the three series in the emission spectra below.
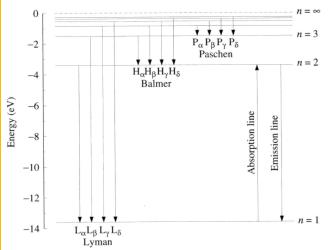 Figure 4 Lyman, Balmer, Paschen
Series
Diagram credited to Astronomers
Amateur du Luxembourg
Figure 4 Lyman, Balmer, Paschen
Series
Diagram credited to Astronomers
Amateur du Luxembourg
Lastly, It is important to know that the
spectra viewed by modern
astronomers is digitally recorded as the spectroscope is aimed at a
celestial body. Instead of bands of light, the scientist
receives a
graph comparing intensity and wavelength. These graphs will have
sharp
inverted peaks at the wavelengths of maximum energy.
If you were using a spectrometer
to observe the light radiating from an incandescent bulb you would see
a continuous spectra.
*What might happen if a cloud of cool gas was surrounding the
light
bulb?
*What would you see if you turned the telescope side ways to capture
the cloud of gas surrounding the bulb only?
Which series would I be examining if a celestial body is radiating a
100nm wavelength?
|
Examine the spectra of many common elements here.
References:
1. Walker, J. Light
and its Uses: Making and Using
Lasers, Holograms, Interferometers, and
Instruments of Dispersion. W.H. Freeman: San Francisco, 1980; pp 93, 106
2. Spacetech's Orrery. The
Solar System in Action. http://www.harmsy.freeuk.com/sun.html
(accessed on March 20, 2008)
3. Seeds,
M.A. Foundations of Astronomy; Thomson
Brooks/Cole: Canberra,
2007; pp 145-147
4. Schweiger, P.E. Homepage. http://www.pschweigerphysics.com/light.html
(accessed on March 25, 2008).
5. Astronomers Amateur du Luxembourg Homepage.The Hertzsprung-Russell Diagramm
www.aal.lu/SPECIAL_TOPIC/6/ (accessed April 13, 2008).