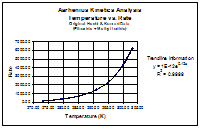
Arrhenius Kinetics Analysis


Introduction:

Svante Arrhenius lived and researched during the latter part of the nineteenth century, and the early part of the twentieth century.  Despite his background in electrochemistry, he was among the first to examine and to attempt to quantify the connection between a rise in temperature and an increase in CO2 in the atmosphere (http://earthobservatory.nasa.gov/Library/Giants/Arrhenius/arrhenius_4.html).  It is increasingly clear that his climatological research was quite prescient.  However, what he is certainly best known for is his development of what is now referred to as the Arrhenius Equation.  The Arrhenius Equation is an equation that establishes the relationship between the temperature of a system and how quickly the reaction in the system will take place.  While he was not the first person to propose the relationship (that person would be Jacobus Henricus van't Hoff), he was, by using data provided by many other scientists, including van't Hoff, the first scientist who was able to provide a clear explanation for the suggested relationship.  The Arrhenius Equation is as follows:

k = Ae-Ea/RT

In this equation k represents the reaction rate, Ea represents the activation energy, R is the gas constant and T is the temperature.

For this assignment, we were asked to use the Microsoft Excel to analyze the data that Arrhenius collected from Hecht and Konrad's Ethoxide + Methyl Iodide experiments, and to discuss what it reveals about the Arrhenius Equation.

Temperature vs. Rate

For the first graph, I plotted the Hecht & Konrad data as a Temperature vs. Rate relationship.  This produced a fairly smooth exponential curve.  When I applied a trendline, and found the trendline equation, the equation was found to be an exponential equation, in which e is raised to the power of x(fraction of a number).  This reflects the Arrhenius equation (see equation above).  The R2 value is .9999, indicating a high level of accuracy in the data points.

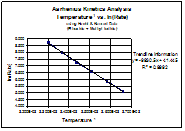
Given that ln(x) = ex, it would follow that if the data were viewed as 1/T vs. ln(rate), we would see a straight line, if Arrhenius' equation is valid.

Graph #1
aarhenius graph #1 thumbnail
Click Here to See the Graph and Data

Temperature-1 vs. ln(rate)

In fact, we do see the predicted relationship.  With further examination, we can also see that if we manipulate the Arrhenius equation to solve for Ea, the slope of our line will be equal to Ea.

k = Ae-Ea/RT

lnk = ln(Ae-Ea/RT)

lnk = lnA + lne-Ea/RT

lnk = lnA - Ea/RT

lnk =  - Ea/R (1/T) + lnA


Graph #2
aarhenius graph #2 thumbnail
Click Here to See the Graph and Data


              Go To          [Excel Analyses Intro]             [Boyle's Law Verification]                     [Home]

K. Sundeen
Summer 2007