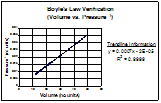
Boyle's Law Verification


Introduction:

Robert Boyle was a seventeenth century English aristocrat who became an influential scientist and researcher, primarily in the field of chemistry.  He and his scientific peers were at the leading edge of the movement to reduce the primacy of Aristotelian thought in scientific study.

One of the most important ideas that he helped to develop (it has been suggested that his assistant, allegedly the better mathematician, was responsible for much of the analysis) became known as Boyle's Law.  This law states that a system, kept at constant temperature, will maintain a constant value for pressure and volume.  In other words,

pV = k

where p is pressure, v is volume, and k is the constant.

Further, Boyle's Law states that this is an inverse relationship.  As pressure increases, volume will decrease.  As pressure decreases, volume will increase.  This relationship can also be expressed in terms of change in volume affecting pressure.

For this assignment we were required to use a set of Boyle's data to try and verify the accuracy of this relationship.

Volume vs. Pressure

For the first graph I plotted Boyle's data as a volume vs. pressure relationship.  This produced an exponential curve that suggests that as volume increases, pressure decreases.  When I applied a trendline, the trendline equation, though exponential, showed an inverse relationship.  This is so, because x is raised to the power of -.9984, which is almost -1.  Any x raised to the power of -1 is equal to 1/x.

For this reason, I surmised that if I created a graph where the relationship was pressure vs. the inverse of temperature, I would have a straight line.
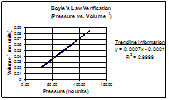

Volume vs. Pressure
Click here for the graph and data
Boyle Graph #1

Pressure vs. Volume-1

In fact, I was correct in my assumption.  This graph shows a straight line that shows an inverse relationship between pressure and temperature.  This is a clear affirmation of Boyle's Law, as stated above.

For additional confirmation I chose to graph the other inverse relationship.

Pressure vs. Volume-1
Click here for the graph and data
Boyle Graph #2

Volume vs. Pressure-1

The other inverse relationship, volume vs. the inverse of pressure, also showed the straight line.  This clearly establishes the accuracy of Boyle's Law.


Volume vs. Pressure-1
Click here for the graph and data
Boyle Graph #3


                   Go To           Excel Analyses Intro         [Arrhenius Kinetics Analysis ]                 [Home]

K. Sundeen
Summer 2007