Contents
Raman Spectroscopy and the Analysis of Gemstones
|
Contents Raman Spectroscopy and the Analysis of Gemstones |
|
|
~ Raman Spectroscopy ~
The Big Ideas Once the Raman effect was discovered, there was no doubt that an opportunity had arisen to make use of the effect as an analytical tool. As such, Raman spectroscopy was born. Analysis of some sample involves monochromatic light from a laser in the visible, near infrared, or near UV range (λ 350-1000 nm), interacting with the phonons (quantized vibrational modes) within the sample. This interaction results in the shifting of the energy of the laser photons up or down (inelastic scattering). The shift (Raman shift) tells us information about the phonon of molecule analyzed. Raman shifts range in wavenumber 50-8000 cm-1, characteristic of molecular vibration. A plot of the intensity of the shifted light versus frequency results in a Raman spectrum of the sample (typically plotted with respect to the laser frequency so that the Raleigh band lies at 0 cm-1.(9) This vibrational information output in the form of a Raman spectrum is specific for different chemical bonds in molecules. Download the following file to view many of the characteristic Raman shifts for various types of chemical bonds (bands.pdf). Although Raman shifts fall into the infrared region of the electromagnetic spectrum, the two forms of spectroscopy (Raman and IR) are complementary to one another mainly due to specific differences in the selection rules for each type. (10) Table 1 below shows a comparison of Raman spectroscopy to IR spectroscopy.
Whereas infrared bands arise from the interaction of light and an oscillating dipole moment of a vibrating molecule, Raman bands arise from an oscillating induced-dipole due to the interaction between light waves and the polarizability (the shape of the electron cloud) of a vibrating molecule. As such, molecules with symmetric stretches, vibrations involving multiple bonds, and vibrations involving heavier atoms will result in strong Raman bands, when otherwise would result in weak IR bands. Asymmetric molecules will demonstrate IR and Raman spectra bands at similar frequencies, but with different intensities. (9) The following link shows an animation that compares the energy transitions of IR, electronic, flurescent, Raleigh, and Raman photons (http://www.doitpoms.ac.uk/tlplib/raman/comparison.php). (5) Below you will find information regarding the common applications of Raman spectroscopy, the advantages and disadvantages of this method (Table 2), the actual device and a description of its mechanisms (Figures 1, 2, and 3), along with an example of a Raman spectrum of CCl4 (Figure 3). Applications of Raman Spectroscopy (17) -Chemical identification and quantification, characterization of molecular structures, effects of bonding. -Identification of frequency (energy/wavelength) ranges associated with vibrational (and also rotational and electronic) energy level transitions. -Use of Raman gas analyzers in medicine for real-time monitoring of anesthetic and respiratory gas mixtures during surgery. -Analysis of crystallographic orientation of a sample. -Identification of counterfeit drugs. -Analysis of the chemical composition of historical documents. -Potential means to detect explosives for airport secutity. Table 2: Advantages &
Disadvantages
of Raman Spectroscopy (6)
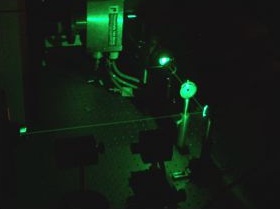
Device The most common type of laser used in Raman spectrometers are argon-ion lasers. Figure 1 shows a picture of some of the key components of a Raman spectrometer, while Figure 2 shows the spectrometer actually in use. (3) Figure 2 enables you to see the path of the laser beam through a slit and its deflection at an angle. 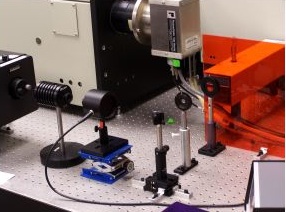
 The actual spectrometer can be broken down into two stages as shown in the schematic of Figure 3 and as described below. 
Figure 1 - Schematic of a Raman spectrometer (16)
Stage One – Monochromator -Once the laser light ((λ 350-1000 nm) is directed at a sample or object, the resulting scattered signal is directed by a collecting lens to the first grating (G1) where the light is separated into different wavelengths. -The separated light is then sent through a slit which can be adjusted to reject wavelengths outside of the desired range (such as light characterized by the laser frequency). -The light that makes it through the slit is refocused by a second grating (G2), which primarily compensates for wavelength dependence on the dispersion of light from the first grating. Stage Two -The filtered light is focused onto a third grating (G3) where it is analyzed according to its position, which corresponds to a particular wavelength. The signal as a function of position is read by a detector and analyzed by a computer. -The computer interprets the information in terms of frequency and intensity, and a Raman spectrum is generated. (16) Figure 4 below shows an example of a Raman spectrum that would be generated by a sample of CCl4. This diagram of the spectrum shows the anti-stokes bands of higher energy and lower intensity (~15990, 16020, and 16210 cm-1) to the left of the Raleigh scattering band (15800 cm-1), and the stokes bands of lower energy and higher intensity (~15520, 15480, and 15310 cm-1). Figure 4 - Spectrum of CCl4
(10)
 |
||||||||||||||||||||||||||||||||||