l=0 Hydrogen Atom Wave Functions:
(* GRAPHICS--Hydrogen Atom Wave-Functions *)
Needs["Graphics`ParametricPlot3D`"]
(* First, for [l=0, n=1,2,3], ie.,1s,2s &3s Orbitals*)
(* the Angular Part Squared for n=1,l=0 at rho=n *)
SphericalPlot3D[1,{th,0,Pi},{ph,0,2Pi}]

-Graphics3D-
(* the (x,y,z=0)-Section of the Wave-Function Squared
for n=1,l=0 *)
Plot3D[Evaluate[(Exp[-Sqrt[x^2+y^2]])^2],
{x,-1,1},{y,-1,1},PlotRange->{0,1}]

-SurfaceGraphics-
(* the Radial Part Squared for n=1,l=0 *)
Plot[(Exp[-r])^2,{r,0,10},PlotRange->{0,1}]

-Graphics-
(* r^2 Weighted Radial Part Squared for n=1,l=0 *)
Plot[(r^2)*(Exp[-r])^2,{r,0,10},PlotRange->{0,0.2}]

-Graphics-
(* the Angular Part Squared for n=2,l=0 at rho=n *)
SphericalPlot3D[2,{th,0,Pi},{ph,0,2Pi}]

-Graphics3D-
(* the (x,y,z=0)-Section of the Wave-Function Squared
for n=2,l=0 *)
Plot3D[Evaluate[((2-Sqrt[x^2+y^2])*
(Exp[-Sqrt[x^2+y^2]/2]))^2],{x,-10,10},
{y,-10,10},PlotRange->{0,0.5}]

-SurfaceGraphics-
(* the Radial Part Squared for n=2,l=0 *)
Plot[((2-r)*(Exp[-r/2]))^2,{r,0,10},PlotRange->{0,1}]

-Graphics-
(* the r^2 Weighted Radial Part Squared for n=2,l=0 *)
Plot[(r^2)*((2-r)*(Exp[-r/2]))^2,{r,0,10},
PlotRange->{0,5}]

-Graphics-
(* the Angular Part Squared for n=3,l=0 at rho=n *)
SphericalPlot3D[3,{th,0,Pi},{ph,0,2Pi}]

-Graphics3D-
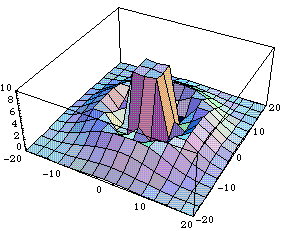
(* the (x,y,z=0)-Section of the Wave-Function Squared
for n=3,l=0 *)

-SurfaceGraphics-
Plot3D[Evaluate[((27-18Sqrt[x^2+y^2]+2(x^2+y^2))*
Exp[-Sqrt[x^2+y^2]/3])^2],{x,-20,20},{y,-20,20},
PlotRange->{0,10}]

-SurfaceGraphics-
(* the Radial Part Squared for n=3,l=0 *)
Plot[((27-18r+2r^2)*Exp[-r/3])^2,{r,0,20},
PlotRange->{0,50}]

-Graphics-
(* the r^2 Weighted Radial Part Squared for n=3,l=0 *)
Plot[(r^2)*((27-18r+2r^2)*Exp[-r/3])^2,{r,0,20},
PlotRange->{0,800}]

-Graphics-
L=0 Wave Functions.JKB
This ends part 1 of the L=0 H-Atom Wave Functions Mathematica files.
You can now see the next, l=0
H-Atom Wave Functions Set Up of Contour Plots file, or return to the
notes.


