l=0 H-Atom Wave Functions Contour Plots in
3-D:
(* Now, for the Contour Plots *)
<<Graphics`ContourPlot3D`
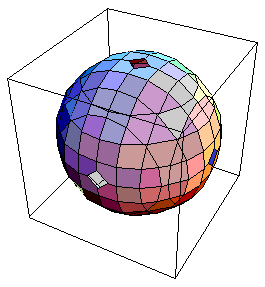
ContourPlot3D[Evaluate[Y1s^2],{x,-2,2},
{y,-2,2},{z,-2,2},Contours->{0.001}]

-Graphics3D-
ContourPlot3D[Evaluate[Y2s^2],{x,-4,4},
{y,-4,4},{z,-4,4},Contours->{0.001}]
-Graphics3D-
ContourPlot3D[Evaluate[Y3s^2],{x,-7,7},
{y,-7,7},{z,-7,7},Contours->{0.0003}]

-Graphics3D-
H-AtomWF"s;l=0.ContourPlot3d.JKB
This ends the Mathematica files for the L=0 Hydrogen Atom Wave
Functions. You can now return to the
notes.