


Home MCEP home
E-portfolio CHEM501
Arrhenius Kinetics: ethoxide
+ methyl iodide
|
The purpose of this data analysis is to analyze the
set of temperature and rate data collected by Hecht and Conrad in 1889
for the reaction of ethoxide and methyl iodide, present it
in graphical form, and calculate the activation energy. The data
were
downloaded from Giunta's
Classical Chemistry site.
The Arrhenius equation relates the rate constant, k,
to
1) the frequency factor, A, which
takes into account the ease with which molecules collide in the proper
orientation for reaction
2) the activation energy, E,
which is the energy required for the reactants to reach the higher
energy transition state before formation of the product, and
3) the absolute temperature, T,
in Kelvin.
It is often written in the following form,
k= Ae-E/RT
(eq. 1)
where R is the ideal
gas constant, 8.314 J/ (mol*K) or 1.99 cal/ (mol*K).
By
taking the natural log of the equation, (eq.1) can be changed into the
following form, which can be manipulated into a linear equation:
ln k
= -E/R
(1/T) + ln A
(eq. 2)
y
=
m
x
+ b
By
plotting the natural log of the rate constant (ln k) as a function of
the inverse of temperature (1/T), the slope, m, of the resulting linear
plot is equal to the negative of the activation energy divided by the
gas constant (-E/R). By multiplying the slope by the negative of
the gas constant, once can determine the value of the activation
energy, E.
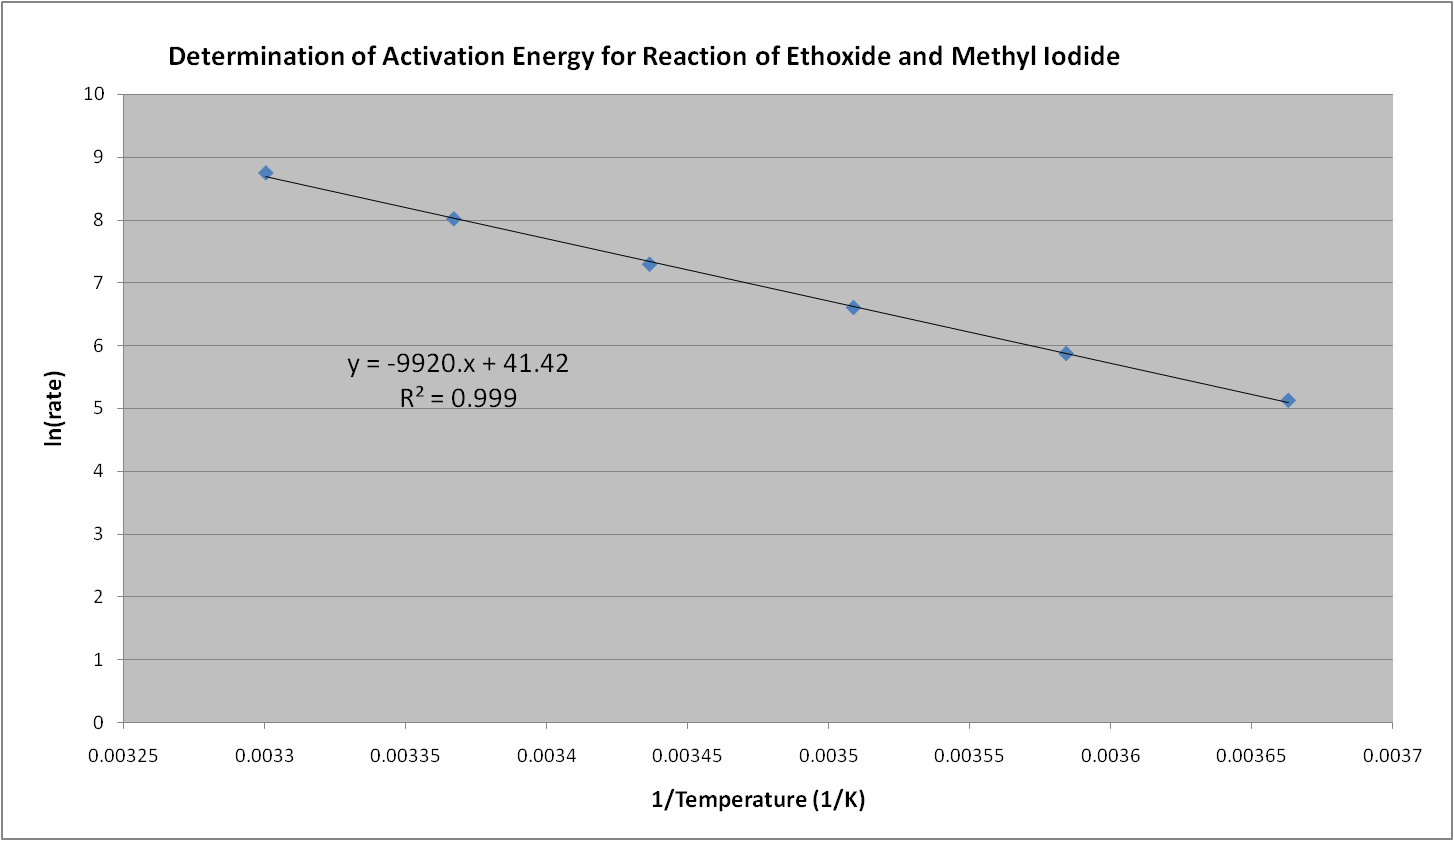
A
plot of ln (rate) vs. 1/T was made, and a linear regression line
fitted to the data. In Hecht
and Conrad's experiment, the rate, rather than the rate constant was
measured. The assumption is made that since the two are directly
related, the slope provided by the plot will be the same. The equation for the
trendline is provided in the graph.
| T(°C) |
Rate
|
T
(K)
|
1/T
(1/K)
|
ln
(rate)
|
0
|
168
|
273
|
0.00366
|
5.1240
|
6
|
354
|
279
|
0.00358
|
5.8693
|
12
|
735
|
285
|
0.00351
|
6.5999
|
18
|
1463
|
291
|
0.00344
|
7.2882
|
24
|
3010
|
297
|
0.00337
|
8.0097
|
30
|
6250
|
303
|
0.00330
|
8.7403
|
|
|
The slope for the
trendline equation can be used to calculate the activation energy, E,
for this reaction:
ln k = -E/R (1/T) + ln A
y
= -9920. x + 41.42
slope, m = -9920. =
-E/R
E = m * -R
=
(-9920.)* ( -8.314 J/ (mol*K)) = 82,480 J = 82.48 kJ/ mol
=
(-9920.)* (-1.99 cal/ (mol*K)) = 19,700 J = 19.7 kcal/ mol
In
conclusion, the plot and the good fit of the trendline (R squared value
= 0.999) show that
Arrhenius's equation correlates the rate with temperature quite
well. Furthermore, the equation provides a useful method for
graphically
determining the activation energy of a reaction if the rates at various
temperatures are known.