|
Baseline Evidence:
Answer
to Essay #4 &
Reflective self-evaluation from MCE application
JUNE 2007
|
Application
essay #3:
3)
"The mandate seems clear. Every school in America is reportedly
connected (in one way or another) to the rest of the world through
computer technology. . . As clear as this mandate appears to be,
however, all accross America blank computer screens stare out at
teachers, and the teachers stare back. . ." (Goddard, Journal of
Research on Technology in Education, vol. 35., No. 1, Fall 2002, Pg. 19)
- Describe your
experience with and beliefs about the use of technology in the service
of increasing student learning in science.
". . . . My students
use Excel to quickly graph and observe trends and also often use the
web to f ind supplemental infromation. In the next year, I would like to
use Power Points and animations in my lectures and set up a webpage
from which students can download supplementary material.
Eventually, with practice and the support of peers, I aspire to have my
students use computerized lab probes to develop their own experiments."
|
From
reflective self-evaluation:
"I am very
comfortable with my content and can typically come up with the notes
without having to refer to any text or paper. I know that I also
learn things when I write them down, and my teaching
shows a bias toward those students who learn the way that I do.
Because of this, I have not been as quick as some teachers to use
powerpoint presentations; it is easier for me to use the blackboard in
many cases."
|
The
baseline evidence shows that I was hesitant to use powerpoint
presentations because it seemed more difficult; specifically, I had not
used more than one or two powerpoints in my four years of teaching
before entering the MCE program. I did have the desire to get
better acquainted with this technology, but I did not have the
structure or direction to make this happen.
While I do NOT have
specific evidence showing my discomfort and lack of exposure to
applets, Chemdraw, or the Spec20 in my teaching,
it would be accurate to say that I would probably not have integrated
them into my teaching, or at least not so quickly, without the
influence of the MCE coursework and my fellow cohort members.
|
Later
Evidence:
(Note: Reflections detail how I grew in my ability to use technology
through the MCE program, specifics of the implementation and the impact
of technology use in my classroom.
Pedagogical
relevance/ impact is bolded
and highlighted)
|
|
EVIDENCE
#1:
Gas
applet and solution applet from PHeT
APRIL 2009 and MARCH 2009, respectively
|
|
(click on
pictures to link to the PHeT site)
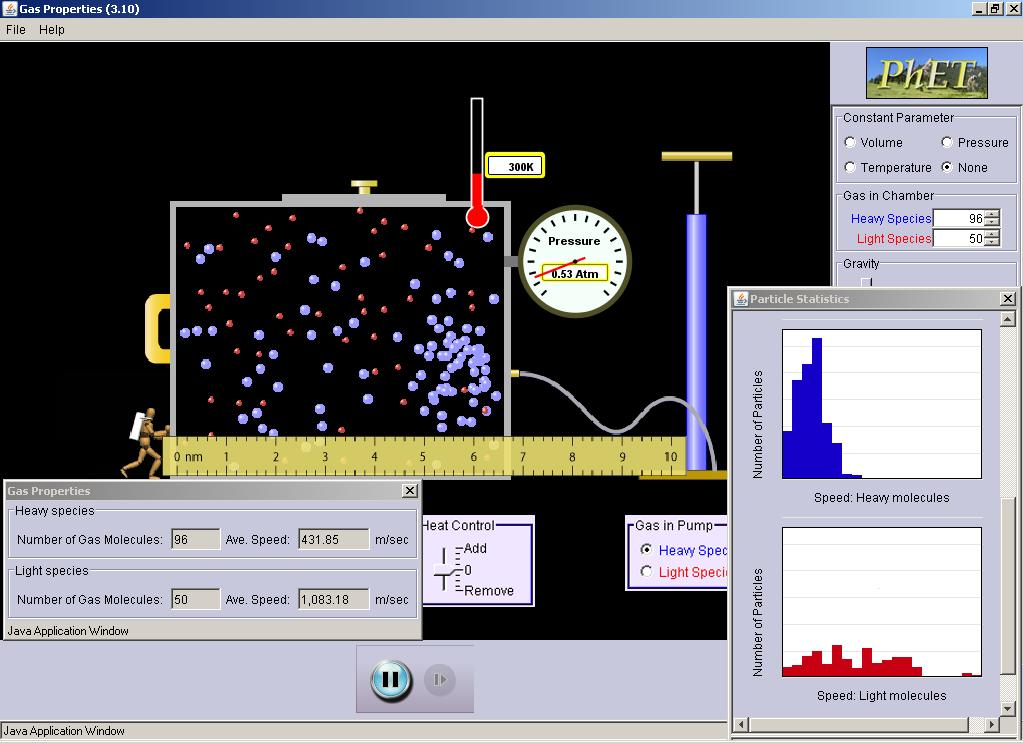
Gas applet
|
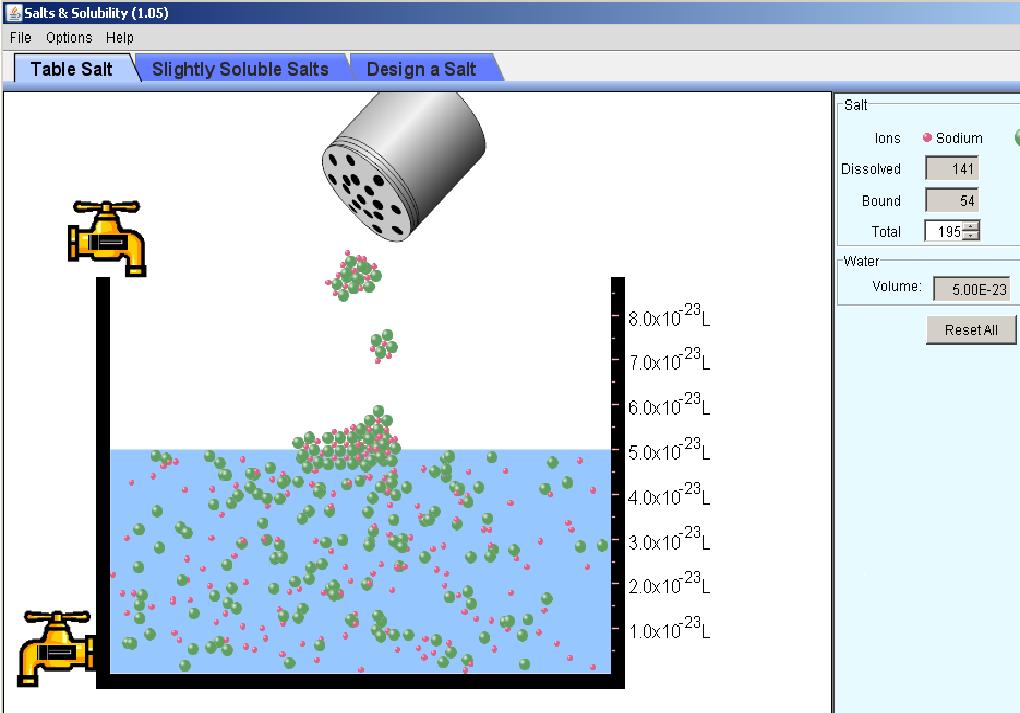
Salts
& Solubility applet
|
I
used this gas applet and the accompanying
POGIL (created
by Mike Ames) at the beginning of my gas properties
and gas laws unit. It
provides an excellent visualization
of the
kinetic, particulate nature of gases that is responsible for
pressure. Students can also "see" how speed is related to mass
and temperature in an intuitive way.
|
I use
this salt and solubility (solutions) applet to help students
visualize the submicroscopic interactions that explain why ionic
compounds dissolve in water to produce electrolytic solutions.
|
The first piece of
evidence shows the applets I used in my classroom (with a POGIL or in
conjunction with a lecture) to help students visualize the
submicroscopic interactions behind many of the concepts and
relationships they were learning. Prior to using applets in my
instruction, I would try drawing these interactions on the board (an
imperfect, static drawing that often did not do justice to the concept)
or simply expect that my students could imagine what I was saying.
With
a POGIL
The gas
applet provided the perfect information model for the
POGIL. Each student completed the POGIL sheet
individually (one
computer to each student) and then discussed and checked their answers
with the two people closest to them. It was fun, interactive, and
open-ended (with certain set parameters that helped prevent against the
creation of incorrect understandings). I observed that students
were engaged and on task since the POGIL demanded that they interact
with the model to find the answers. I even
witnessed students
arguing and discussing their answers to the POGIL when they did not
agree, and then returning to the model to verify who had observed the
model correctly. It was a beautiful thing!
With
Lecture
I
thought
the salt and solubility applet more useful as a quick (but
informative) visualization of solvation, rather than something I would
use (at this point) as the model for a POGIL. Nonetheless, it
certainly improved students' ability to imagine ionic compound
dissociation!
Here is a list of applets by topic
(.pdf file with
embedded links).
|
|
EVIDENCE
#2:
- My thesis
Powerpoint presentation with embedded Chemdraw diagrams AUGUST 2009
- Powerpoint
presentation used in conjunction with lecture and review of light and
the electromagnetic spectrum in Honors Chem class FEBRUARY 2009
- Examples
of student movie presentation and Powerpoint presentation on a periodic
law lab (used as optional
assessment in lieu of lab report) in Honors Chem class MARCH 2009
|
The second piece of evidence shows how I have become
more skillful in my use of Powerpoint and Chemdraw, as well as how I
have encouraged students to become more comfortable in their use of
powerpoint presentations in the 2008-2009
school year. If
I am not proficient with basic skills within a software program, I find
it difficult, if not impossible, to teach my students how to
successfully navigate that program and attain same or higher levels of
competency. Because of all of my coursework assignments that
required
practicing basic skills in Powerpoint and Chemdraw, I gained the skill
and confidence to integrate it into my teaching and help students
improve their use.
Note that in the movie of my thesis powerpoint presentation, I
incorporated animations of text, graphics, and shapes that helped
organize information and highlight particular features or points.
I
also used images taken from online searches, as well as tables and
diagrams from Excel and Chemdraw, respectively. I used various
features in Chemdraw to highlight important functional groups where
appropriate.
In my powerpoint presentation on light and the EM spectrum, I
exploited
Powerpoint's ability to show good images that
made certain lecture
ideas more understandable. Particularly with abstract concepts
that are difficult to visualize, like light, electromagnetic waves,
atomic absorption and emission, a good picture takes the place of a
thousand words (at least).
This second Powerpoint
presentation
does not include as much text because I was filling in much of the
information with lecture.
The
examples of
student work show how I have held my students accountable for the use
of technology in my class. I
think the ability to learn and adapt the presentation of information
into various electronic media is increasingly important in this
information age, so even apart from the Chemistry content, I think this
experience worthwhile. Last year, after a periodic law
lab, I gave students the choice
of writing a lab report or making a powerpoint movie (with audio, when
possible). I modeled the steps needed
to convert a Powerpoint presentation into a movie file, and then
encouraged students
to try making a movie by giving those who attempted it extra
credit. I
plan on making this a more prominent feature of my class this year
(2009-2010).
|
|
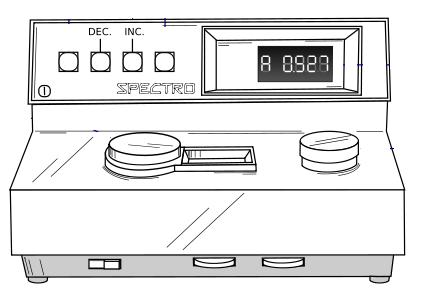
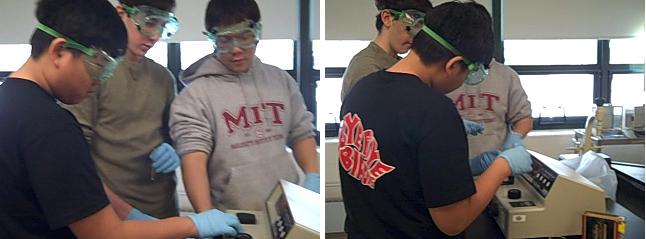
EVIDENCE
#3:
Use of Spec20 in APChem class
MARCH 2009
|
|
Lab group:
|
|
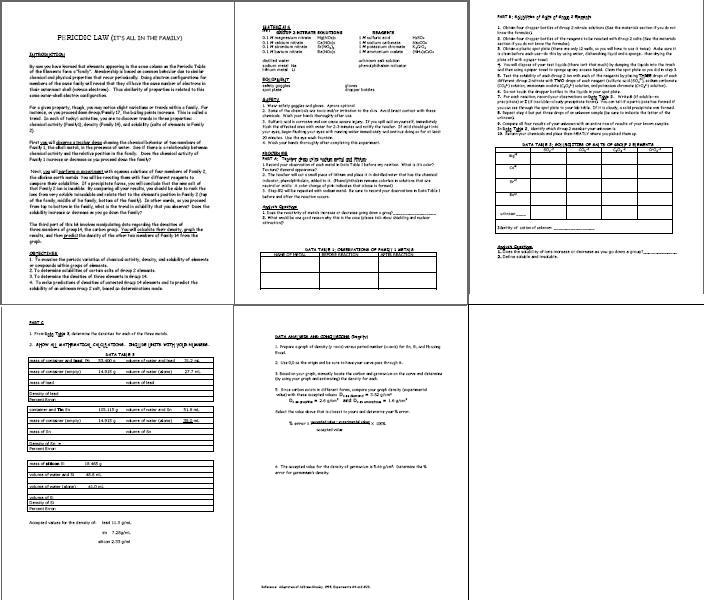
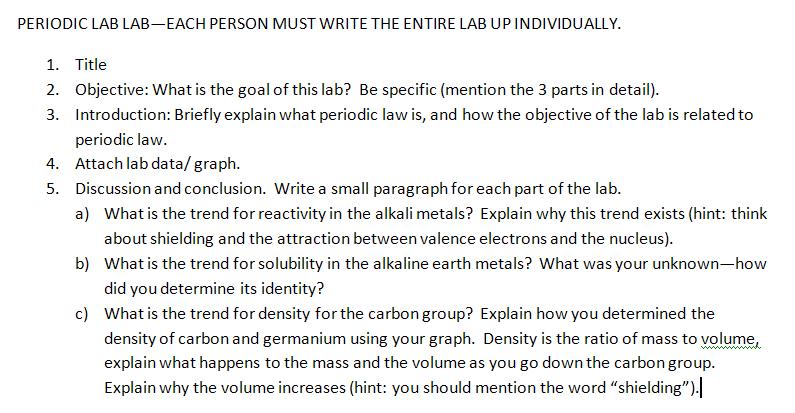
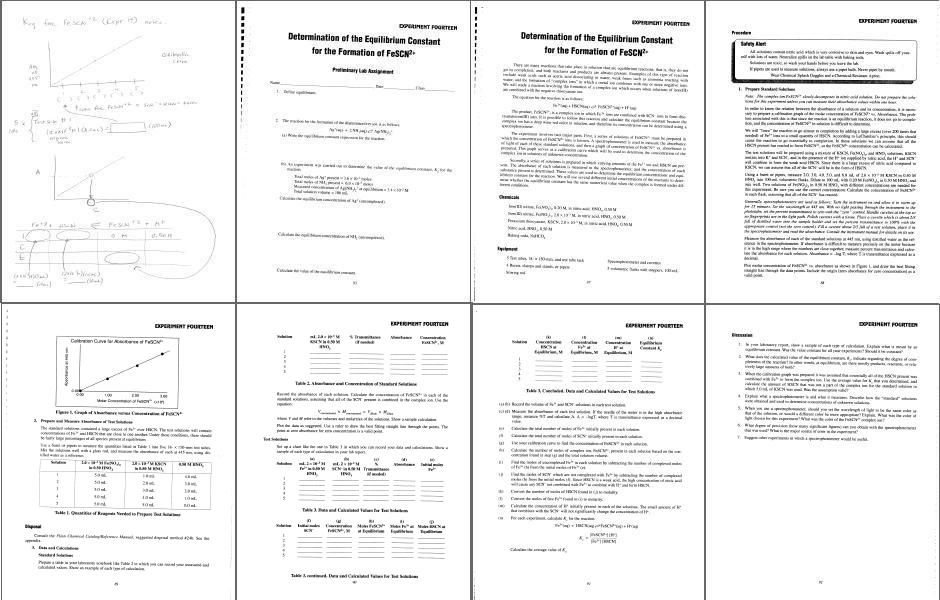
Supporting documents:
(click on image for full .pdf)
From Vonderbrink,
Sally. Laboratory Experiments for Advanced Placement Chemistry,
Flinn
Scientific, Inc, 1995. |
Having
done the same lab in
Spectroscopy class, I felt better prepared to guide students
through the lab procedures outlined in the Flinn AP lab book. The
first page of the .pdf file above shows how I reinterpreted the
directions and connected the calculations to the "ICE box" method I had
taught my students in preparing students for the lab. Actually being able to use a Spec20 made
the learning of Beer-Lambert's law more tangible (rather than just a
formula to be memorized). Student could see how the relationship
between color intensity (i.e. absorption) and concentration could be
applied to determine concentrations of substances at equilibrium, and
therefore the equilibrium constant.
|
August
6, 2009
|


 <--PREVIOUS
REFLECTION
<--PREVIOUS
REFLECTION